


CloudPhysics Adds Global and Daily Insights to VMware Management Tool
Also refines alert options with storage usage.
This is a Press Release edited by StorageNewsletter.com on September 2, 2014 at 2:48 pmCloudPhysics, Inc. announced enhancements to its SaaS-based solution, including global insights that make it possible for VMware users to continuously benchmark their virtual infrastructure against global metrics.
In combination with interactive daily insights, which aggregate and expose operational hazards from across the datacenter, global insights enable users to identify areas for improvement in their own environments as well as specific actions for achieving better datacenter health, performance and efficiency.
The company is also previewing its ‘workload shapes’ technology that provides VMware administrators with a visual shorthand for recognizing storage performance anomalies, and deep visibility for accelerating resolution.
“Today’s announcement delivers further on CloudPhysics’ commitment to use Big Data to help IT teams make smarter operational decisions for better datacenters,” said John Blumenthal, CloudPhysics VP product management. “We continue to formulate new ways to put data to work for our customers, yielding relevant insights at the right time, in the right context. From broad aggregation of operational metrics gathered across thousands of datacenters, to highly granular views into individual workload shapes, our data-driven insights give IT teams more power than ever before to understand, troubleshoot, and optimize their virtualized datacenters.“
News Highlights
The cloud-based platform collects and analyzes a daily stream of configuration, performance, failure and event data from a global user base, with a total of 50+ trillion samples collected to date. Combining this big data with datacenter simulation and resource management techniques, it identifies global trends and patterns of behavior.
This collective intelligence is passed on to customers through the algorithms
that drive the features and capabilities here announced:
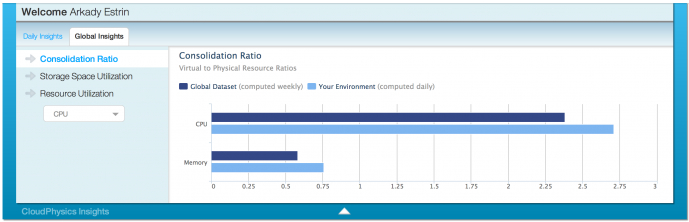
- Global Benchmarks and Daily Insights: An interactive console provides global and daily insights, both of which are continually refreshed. Global Insights compare a user’s datacenter metrics against those from CloudPhysics’ global data set, providing benchmarks for evaluating relative performance, health and efficiency. Daily Insights aggregate alerts and recommendations generated by CloudPhysics across the datacenter and, with hyperlinking capabilities, provide the ability to navigate and drill down contextually to gain deeper visibility, accelerate resolution and improve overall datacenter metrics.
- Enhanced Performance Troubleshooting: Building on the Datastore Contention analytic, which provides insights into disk I/O contention at the datastore level, the VM Disk I/O contention analytic focuses on VM-level performance. An interactive timeline visually correlates patterns among datastores/VMs, and simplifies the exploration of hotspots. The algorithm used to detect contention has been tuned and validated using CloudPhysics’ Collective Intelligence.
- Smart Alerts: ‘Guest Partition in VM Running Out of Space’ and ‘Unused VMs’ further expand the set of SmartAlerts, first introduced in June. The company evaluates all objects in the virtual datacenter against certain criteria (e.g., latency, duration, outstanding IOs, IOPS, etc.) and triggers Smart Alerts based on thresholds derived dynamically from patterns and trends observed across our global dataset. Users foresee when conditions are degrading and receive specific recommendations for preemptive measures.
- Workload Shapes (Technology Preview): The business analyzes and characterizes storage workload spatial locality (sequentiality vs. randomness), dominant I/O block sizes, and the complete latency profile, then visualizes these into ‘workload shapes.’ Administrators learn which shapes are ‘normal’ for their environment and identify outliers that indicate performance troublespots, accelerating time to resolution. This visibility comes from underlying technology, in which every I/O is analyzed, ensuring anomalies don’t get lost in the averages, which is what happens with most other tools.


 Subscribe to our free daily newsletter
