


Which Are More Reliable HDDs Almong 49,056 Tested? – Backblaze
HGST global winner in front of Toshiba, Seagate and WD in 2015
This is a Press Release edited by StorageNewsletter.com on October 20, 2015 at 3:18 pmWhat Can 49,056 HDDs Tell Us? HDD Reliability Stats for Q3 2015
 This article has been written on October 14, 2015 on the blog of Backblaze, Inc. by director of product marketing Andy Klein.
Q3 2015 HDD Reliability Stats
As of the end of Q3 2015, there were 50,228 drives spinning in the Backblaze datacenter. Subtracting boot drives, drive models with less than 45 drives and drives in testing systems, we are publishing data on 49,056 HDDs spread across 26 different models, varying from 1TB to 8TB in size.
What’s New for the Q3 2015 Results?
In this edition, we are publishing the data on our 1TB drives for the first time. The data was always available in the data files we publish on our HDD Data web page, but now we’re reporting the data here too. We are also going to include ‘Average Drive Age’ for each model and we’ll summarize the data by manufacturer size as well.
HDD Failure Rates
Let’s start by breaking down the drives by size and comparing them over time:
Backblaze HDD failure rates
Ordered by drive size (2013 through 3Q15)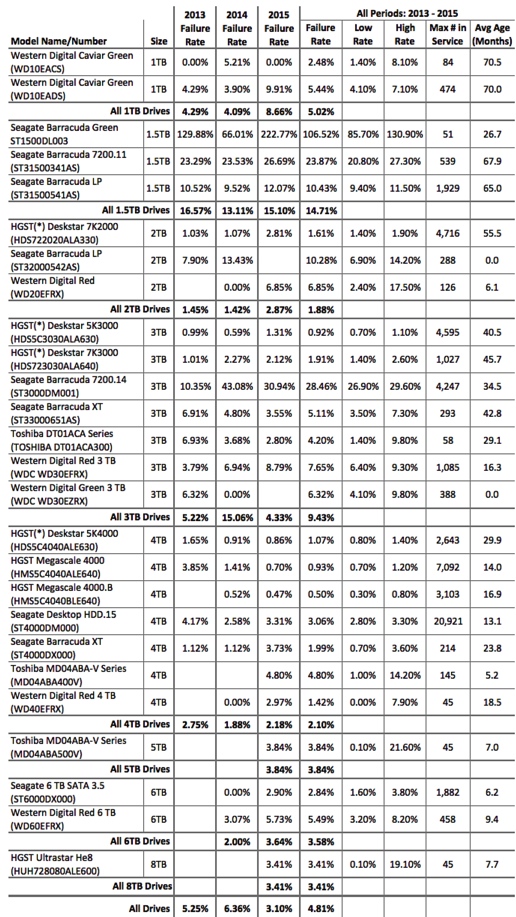
There’s a lot going on in the chart above, here are a few things to help out:
- The 2013, 2014, and 2015 failure rates are cumulative for the given year. In the case of 2015 that is through Q3 (September).
- If the failure rate is listed as 0.00% there were drives in use, but none of the drives failed during that period.
- If the failure rate is blank, there were no drives in use during that period.
- The ‘All Periods’ failure rates are cumulative for all data (2013-Q3 2015).
- The ‘Max # in Service’ column is the maximum number of drives ever in service for the given HDD model.
- The ‘Avg Age (Months)’ column is the average age of all the HDDs of the given HDD model. This is based on SMART 9 data.
- If the ‘Avg Age (Months)’ data is 0.0, the given drive model was not in service during 2015 making the value difficult to compute. (We’ll try to figure out a better way to compute this value by the next report.)
- The HGST (*) model name – we’ve been asked to use HGST in place of Hitachi and we are honoring that request, but these drives report their model as Hitachi and are listed as such in the data files.
- The Low Rate and High Rate are the boundaries for the confidence interval for the failure rate listed.
Some Observations Based on This Data
In the chart below are the failure stats for all of the drives in the review, broken down by year. We’ve also computed the average failure rate for all periods for all drives at 4.81%.
HDD failures rates, all drives, all manufacturers
(Year 2013-2015)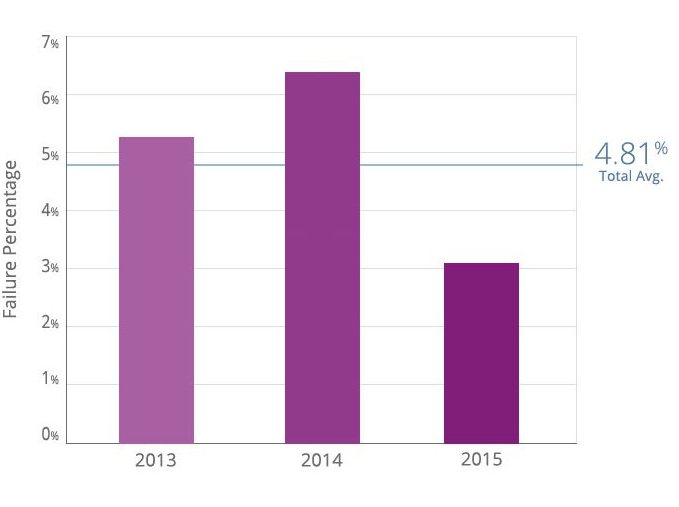
The Western Digital 1TB drives in use are nearly 6 years old on average. There are several drives with nearly 7 years of service. It wasn’t until 2015 that the failure rate rose above the annual average for all drives. This makes sense given the ‘bathtub’ curve of drive failure where drives over 4 years start to fail at a higher rate. Still the WD 1TB drives have performed well for a long time.
Nearly all of the 1TB and 1.5TB drives were installed in Storage Pod 1.0 chassis. Yet, these two sizes have very different failure rates.
Nearly all of the 2TB and 3TB drives were installed in 2.0 chassis. Yet, these two drive sizes have very different failure rates.
Always consider the number of drives (Max # in Service) when looking at the failure rate. For example, the 1.5TB Seagate Barracuda Green drive has a failure rate of 130.9%, but that is based on only 51 drives. We tested these Seagate drives in one Storage Pod in our environment and they were not a good fit. In general, we’ve found it takes at least 6 Storage Pods (270 drives) worth of drives to get good sense of how a given drive will perform in our environment.
4TB drives, regardless of their manufacturer, are performing well. The 2.10% overall failure rate means that over the course of a year, we have to replace only one drive in a Storage Pod filled with these drives. In other words, on average, a pod comes down for maintenance once a year due to drive failure. The math: 2% is 1 out of 50. There are 45 drives in a pod, so about once a year, one of those 45 drives, on average, will fail. Yes, the math is approximate, but you get the idea.
6TB drives, especially the Seagate drives, are also performing well, on par with the 4TB drives so far. The 6TB drives give us 270TB Storage Pods, giving us 50% more storage at the same overall cost per gigabyte.
The 5TB and 8TB drives are performing well, but we only have 45 of each in testing, not enough to feel confident in the numbers yet as can be seen in the confidence interval (low rate/high rate) of these drives.
Drive Failures by Manufacturer
Below is the chart of failure percentages by manufacturer. This is for all the drives in this analysis for the years noted.
HDD failure rate by manufacturer
(Year 2013-2015)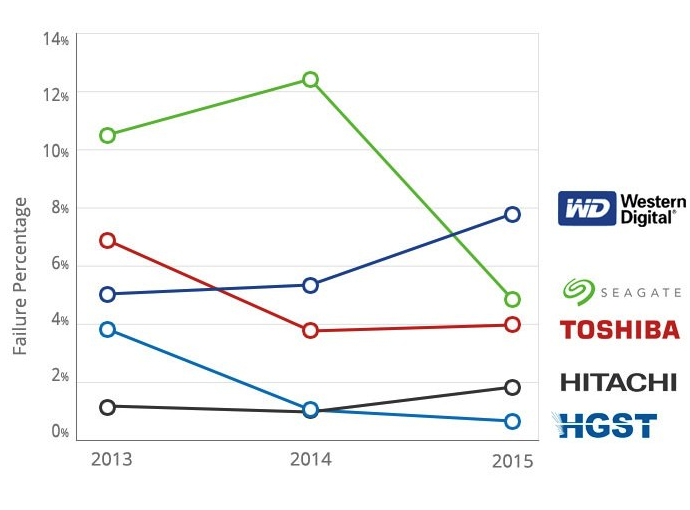
Our Environment
All the HDDs in this review are used in the production systems in our datacenter. The environment is climate controlled and all drives are individually monitored. Each day we pull the available SMART stats reported by each and every drive. These stats are available for download from our HDD Data web page. Those stats form the basis for this blog post.


 Subscribe to our free daily newsletter

