


Capacity SSDs Cheaper Than Capacity HDDs in 2016 – Wikibon
With use of data reduction and sharing
This is a Press Release edited by StorageNewsletter.com on April 14, 2015 at 2:48 pm
This article was written by David Floyer, co-founder and CTO, Wikibon.
2Q 2015 Storage Cost Assumptions
Table below is Wikibon’s current assumptions for 2Q 2015 of the enterprise cost for storage. This is the street price, after discounts and including distributor margins. Very large organizations can expect bigger discounts. The costs include the first year of basic maintenance. The storage types are split into performance storage and capacity storage.
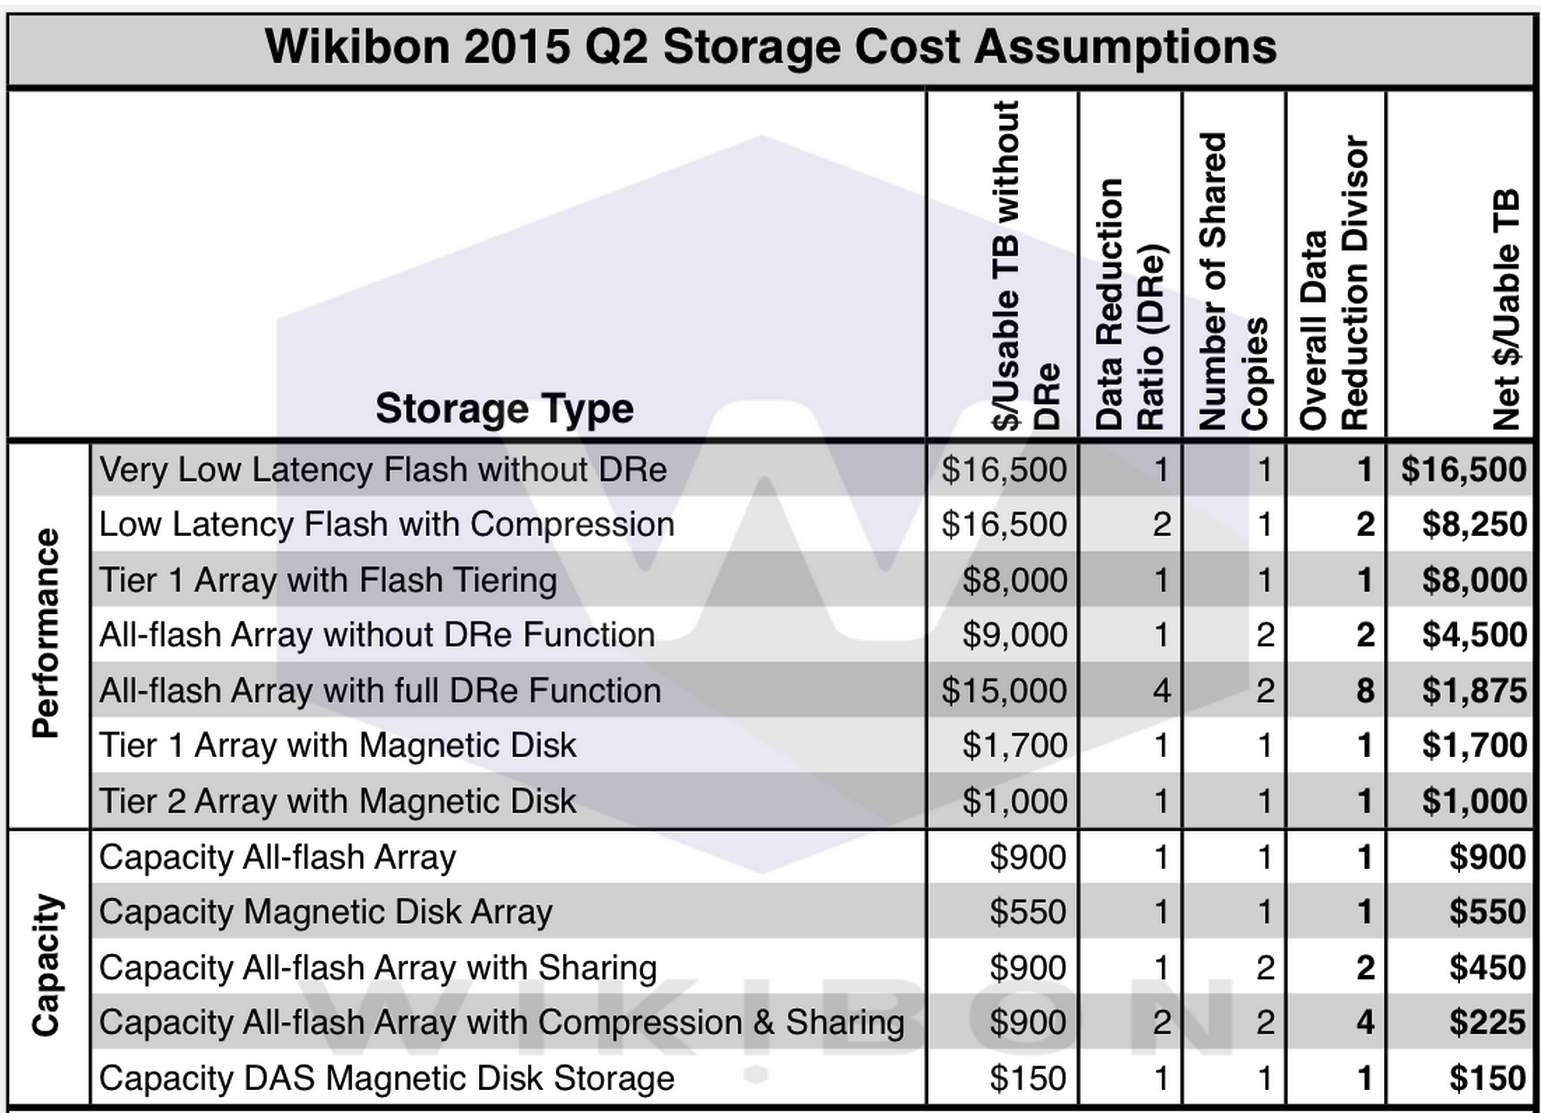
(Source: Wikibon 2015)
The first pricing column is $/usable TB without DRe. A usable terabyte is the number of terabytes that can be used by IT after storage system overheads have been subtracted. These overheads can include metadata, dual copy, and other protection built into the storage system. DRe refers to data reduction, usually from compression and reduplication. The first pricing column assumes the cost without taking into account any DRe impact.
The Data Reduction Ratio column (DRe) represents the average reduction that can be reasonably achieved across the data center as a whole. It does not reflect the maximum capability of that technology in ideal circumstances. The maximum figure in this column is 4, and Wikibon does not expect significant increases in this maximum figure over time. There are specific workloads where the figure will be much higher. VDI is an example, where poor software design has duplicated data. Wikibon expects the VDI software will address this design issue soon. The DRe does not include data sharing using techniques such as space-efficient snapshots.
The Number of Shared Copies column reflects Wikibon’s assessment of what is reasonable to expect using reasonable best practice capabilities as of Q2 2015. This is an emerging technique, and the maximum is 2 currently. Over the next few years, Wikibon expects this will increase to 6 or even more for flash systems, as data center topologies and techniques adapt to the flash storage capabilities.
The Overall Data Reduction Divisor column is the multiplication of the previous two columns. This is used to divide into the first pricing column, to create the final column.
The final column Net $/Usable TB reflects the net cost for acquiring each storage type. Wikibon expects that net flash storage costs will decline at a faster rate than magnetic disk storage over the next few years, driven by a faster decline in raw storage cost, slightly improved DRe ratios, and improve number of shared copies.
Overall storage costs range from very low latency flash at $16,500/TB to capacity magnetic disk at $150/TB. Capacity flash with compression and sharing is now close to at $225/TBe. Wikibon expects capacity flash using data reduction and sharing to be lower cost that capacity disk in 2016.
This data is used in a number of postings, including:
- The IT Benefits of an All-flash Datacenter where it is used for Figure 3: Projection 2015-2020 of Capacity Disk & Scale-out Capacity NAND Flash, and Table Footnotes-1 – Assumptions for 4-year Effective Cost/TB for Magnetic Disk and NAND Flash, 2015 – 2020
- Evolution of All-Flash Array Architectures where it is used for Figure 2: Projection of Technology Costs of Capacity Magnetic Disk Drives and Flash Technologies 2015 – 2020.
Table above should be used as a current indicator of street prices. Wikibon expects NAND flash prices to drop by 30%/year, and disk prices to drop by 20%/year. For installations that can organize to utilize data reduction and data sharing on flash, Wikibon expects that capacity flash will be lower cost that capacity disk in 2016.


 Subscribe to our free daily newsletter


