


All-Flash, All-Disk or Hybrid?
Flash insights and revelations from 1,000 storage users by ActualTech Media and HPE
This is a Press Release edited by StorageNewsletter.com on May 1, 2017 at 2:59 pmSurvey Report: Flash Insights and Revelations From 1,000 Storage Users
Workload Performance and Flash Adoption Sentiment
Written in April 2016 by Scott D. Lowe David M. Davis and James Green, partners, ActualTech Media LLC in partnership With Hewlett-Packard Enterprise
Introduction
We started with a simple question: What surprises have you experienced since you started deploying flash storage in your organization? Of course, surprises can be good or they can be bad, but we sought to understand what may have changed – and what’s not changed – since our survey respondents deployed flash storage into their environments. To that end, we asked 1,000 people to share with us their attitudes and experiences around storage. In this report, we will share with you what we learned and how you may be able to use this information to better inform your own path forward.
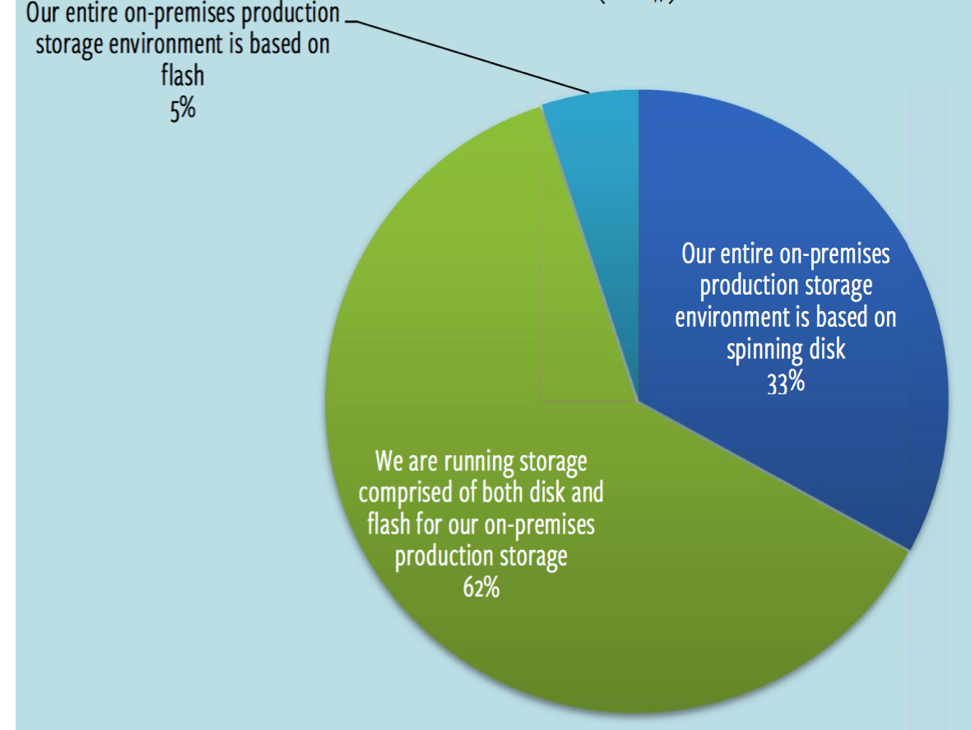
To help you better understand how we’ve analyzed responses, we wanted to learn about what really happens as you make the jump from an all-disk environment to one that includes flash as an element. So, we’ve separated those respondents that identified as running an all-disk environment from those that are running hybrid or all-flash systems. For these purposes, 33% of respondents are running a storage infrastructure based on all spinning disk. 67% have adopted flash in some way – 5% are all flash and 62% are running hybrid environments, which combine flash and spinning disk. Figure 1 provides you with an overview of the respondent storage environment.
Type of On-Premises Storage In Respondent Environments (N=1,047)
Figure 1: Respondents storage environment overview
Flash adoption Rate
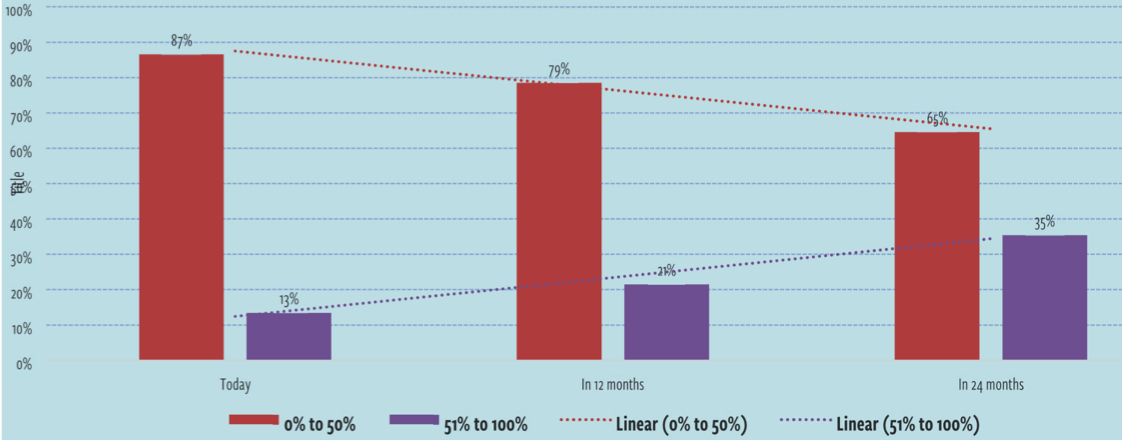
It’s important to know exactly where people stand when it comes to flash. We asked respondents to tell us about how much flash capacity they have in their data center today and how much they believe that they will have in 12 months and in 24 months. Figure 2 shows you that, over the next 12 to 24 months, flash adoption is expected to continue to increase with organizations increasing the overall percentage of flash as compared to disk. The red bars represent those that are running data centers with less than 50% flash storage while the purple bars show those environments that are running more than 50% on flash storage.
Today, we see that just 13% of respondent are running their data centers with more than 50% flash storage, which means that 87% are running with less than 50%. Within the next 24 months, 35% of respondents indicate that they will be running in storage systems compose with more than 50% flash – almost tripling today’s flash penetration. This chart makes it very clear that flash penetration will continue to skyrocket over the next couple of years.
Flash Penetration Overview
Figure 2: Flash Media Adoption Rate
Production Data Center Capacity
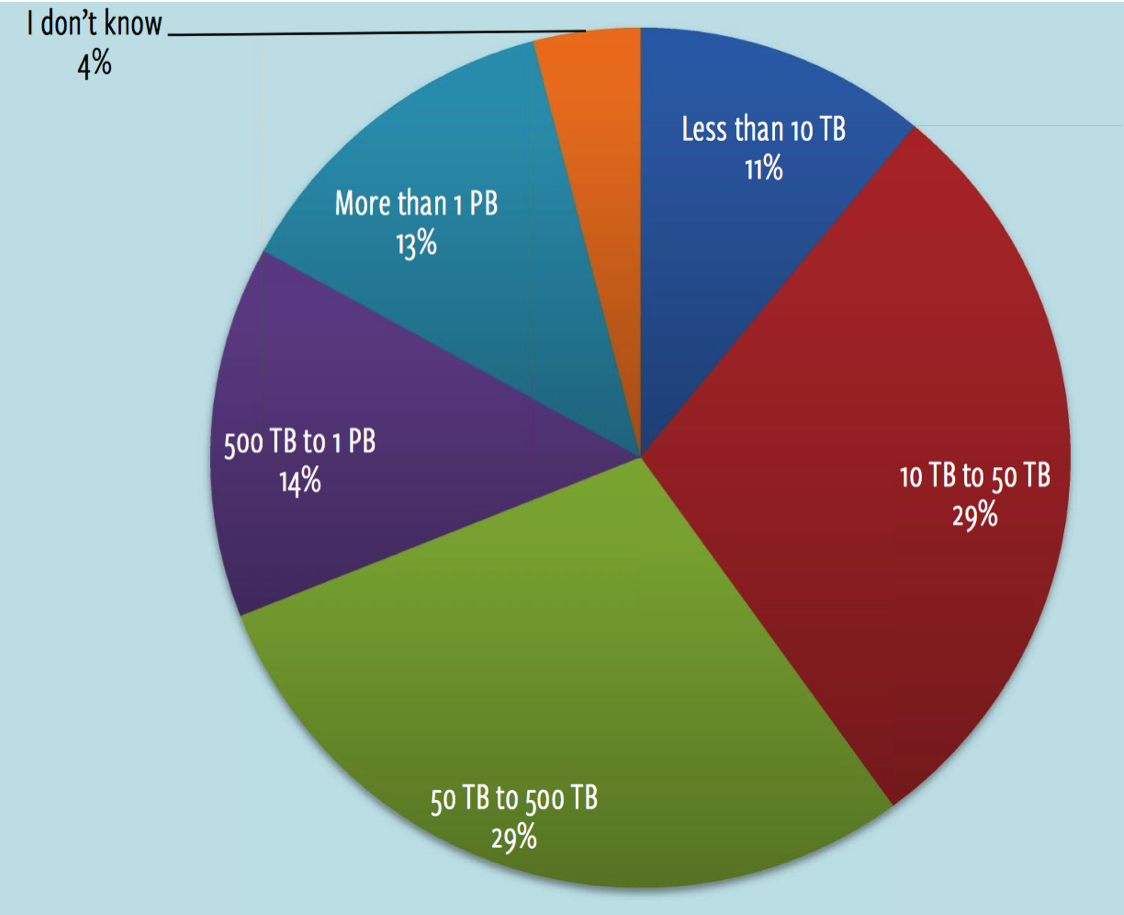
Reviewing the total data capacity in respondent data center reveals that there is a surprisingly even distribution across the capacity spectrum. 29% of respondents have 10TB to 50TB of capacity; 29% have between 50TB and 500TB and 27% have more than 500TB. Just 11% of survey respondents have under 10TB while the remaining 4% of respondents were uncertain about their total capacity. Figure 3 provides you with a look at this breakdown.
Total Production Data Center Capacity (N=1,047)
Figure 3: Total Production Storage Capacity
Company Size
Figure 4: Respondent company size breakdown
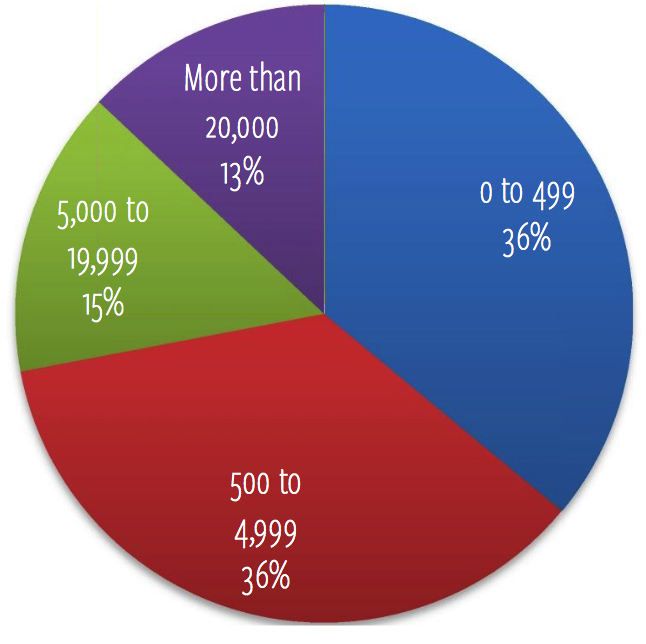
Company size is often discovered to be a key driver in how certain technologies are used. This report will look at some important storage features by company size in order to gain an understanding of how the pool of survey respondents stacks up, Figure 4 provides an overview. As you can see, there is a relatively even – or at least close enough – distribution between small, medium and large (5,000+) companies. In other parts of this report, will also break out very large companies – those with more than 20,000 employees, so they are separate in the chart to the left.
Storage Characteristics
Let’s take a look at what really matters to people. To understand that, we asked respondents to rank order a number of different storage characteristics that need to be considered when buying new flash storage, the results of which are shown in Figure 5.
What is most surprising is that price – an important characteristic, to be sure – actually ranks third overall in relative importance when compared to other characteristics. Coming in ahead of price are performance and resiliency. This doesn’t mean that people are willing to pay a significant premium for storage, but when they do buy, they want to make absolutely sure that the solution will met application performance demands while also being reliable.
As you review later charts in this report, you may notice that there is some lack of consistency in how people view QoS. In Figure 5, QoS doesn’t look that important to many. However, we surmise that QoS is important, but is just of lesser consideration than overall performance, price and the like.
Relative Importance of Storage Characteristics
Figure 5: Relative importance of storage features
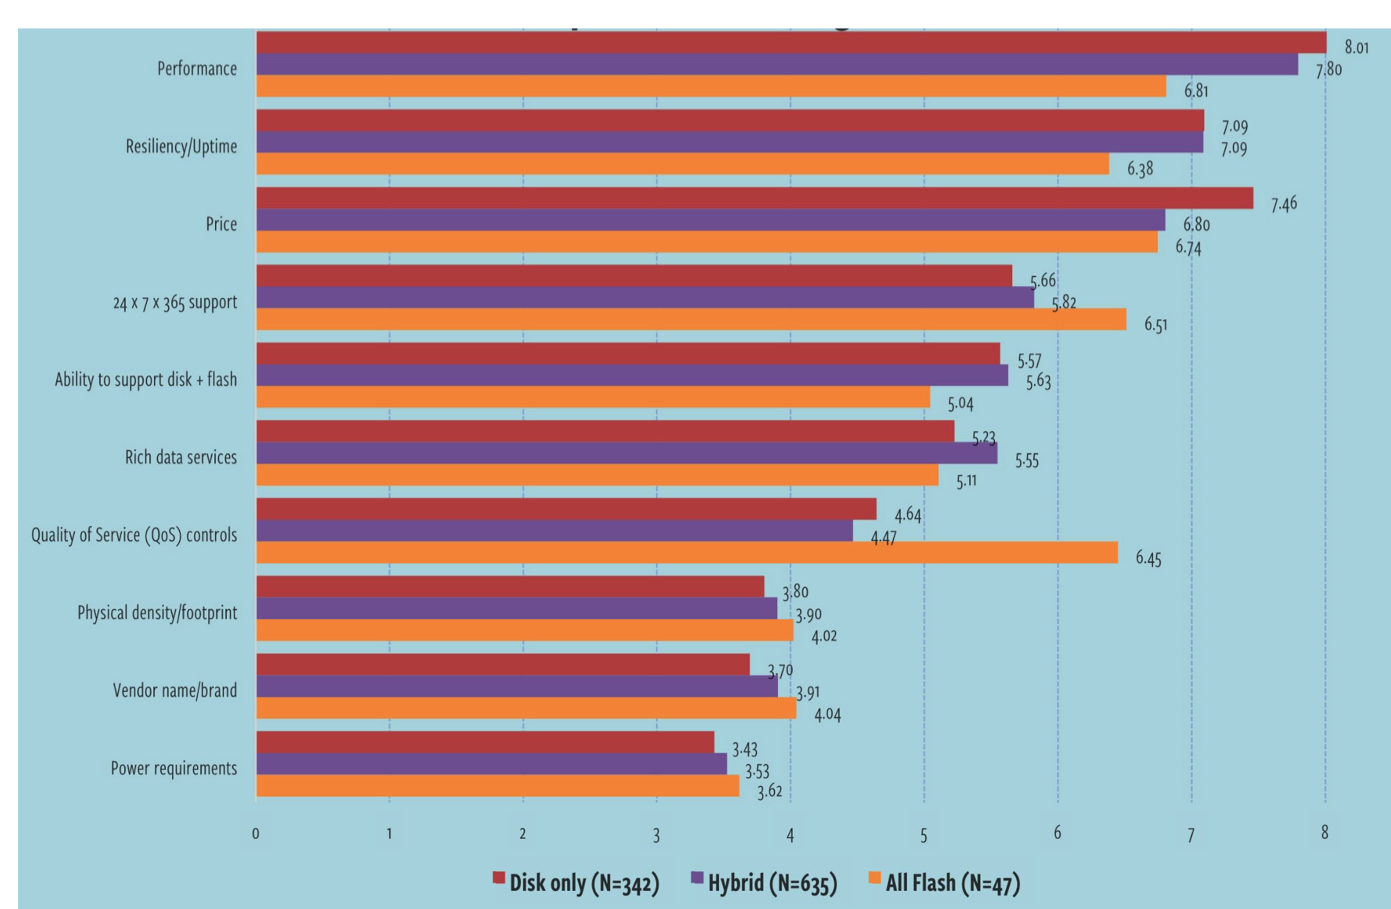
You can see which storage characteristic people found most compelling.
There are a number of key takeaways here that are really important:
- For the most part, the order of the characteristics doesn’t change much. One key exception is price for those that run hybrid storage. There, price comes in third place while it comes in second place for all-disk and all-flash environments. Another key outlier is QoS in flash systems, which comes in fourth place behind performance, price, and support.
- At first glance at the all-flash respondents chart, you may think that performance is not as important as it is for all-disk and hybrid users. We do not believe that this is the case. Rather, we believe that many of those that are buying all-flash systems know that the system will inherently perform well, so they place their priority on other characteristics.
- Physical density was very low on the list of requirements. While reducing rack space might be a ‘nice to have’ feature, it’s certainly not at the top of buyer’s minds when compared to other characteristics.
- Vendor name comes in near the bottom of people’s list of decision criteria. This is a sign that people may be willing to shop around to look for vendors that can meet their more critical requirements.
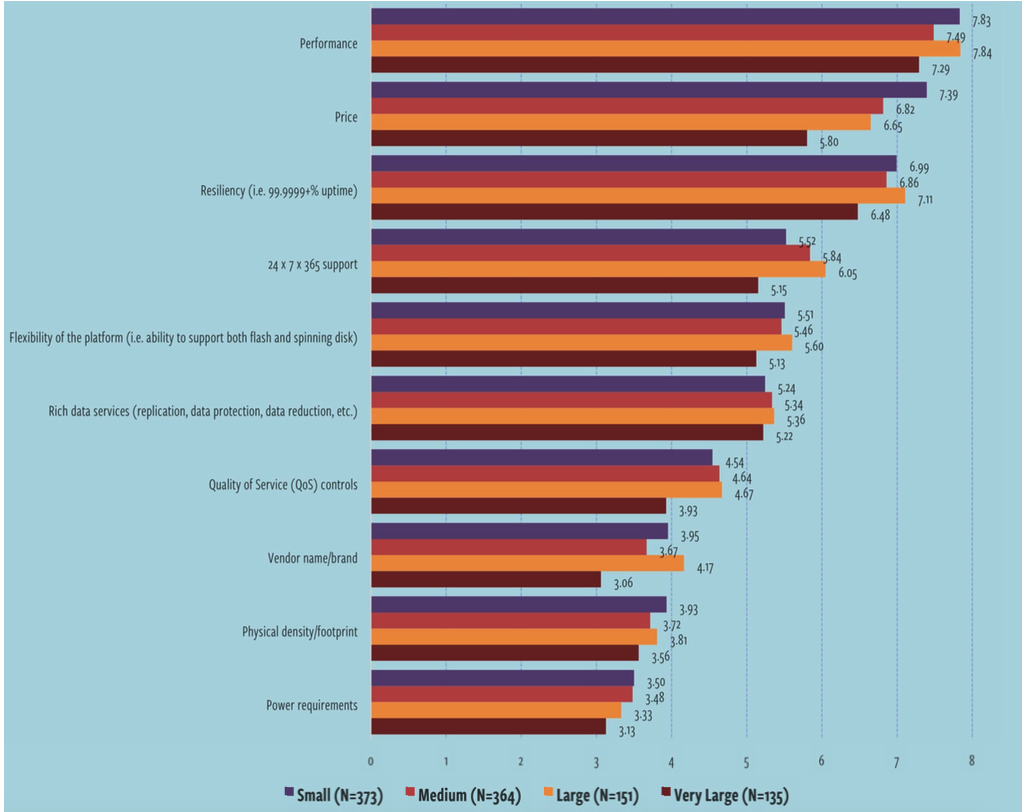
Figure 6 (next page) breaks down storage characteristic importance by company size. Here, you can see that performance and resiliency remain very important, but focus on price changes a bit. Very large companies don’t focus on price nearly as much as smaller companies. Again, price is important, but these companies value other factors first. It’s safe to say that they will still buy on price, but they want systems that will meet their meets.
Relative Importance of Storage Characteristics (by company size)
Figure 6: Relative importance of storage features (by company size)
Workloads
Workloads are where the rubber hits the pavement with regard to storage. If a storage system can’t keep up with your workloads, it doesn’t matter what kind of media it’s running. To discover what kinds of experiences people are having with their storage, we asked respondents to tell us how well certain workloads perform.
For each of the charts in the following workload sections, we are presenting to you respondents’ experiences with regard to how each workload performs. In these charts, you will see where people feel workloads are running poorly and where they’re running well. We break this down by storage type – disk and hybrid/all-flash.
This is not meant to be a comparison. These results originate from respondents answering questions around how well these particular workloads are running in their current storage environment. In cases in which a workload is running well in both a disk environment and a flash environment, it may seem like there isn’t much upside to flash, but that’s not what these data points are meant to convey.
Many workloads – for example, server virtualization and Microsoft applications – are staples of the enterprise and the business would not stand for poor performance. As such, for many respondents, the disk-only environment they have in place is adequately meeting their performance needs… for now.
You will note that there are some workloads – VDI, big data, Oracle – which, when run on flash, make for many happier people.
Oracle
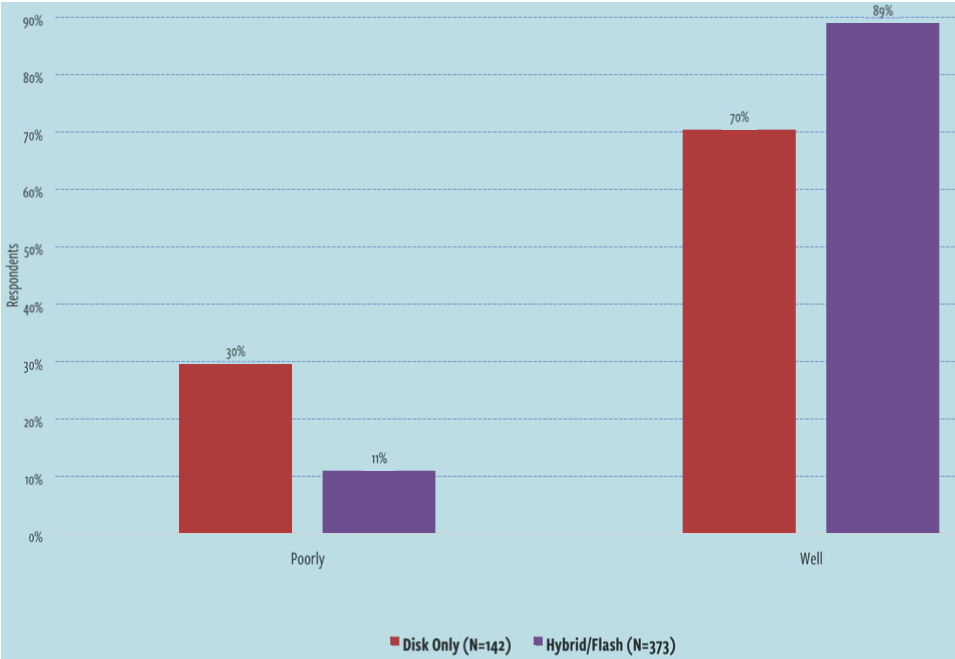
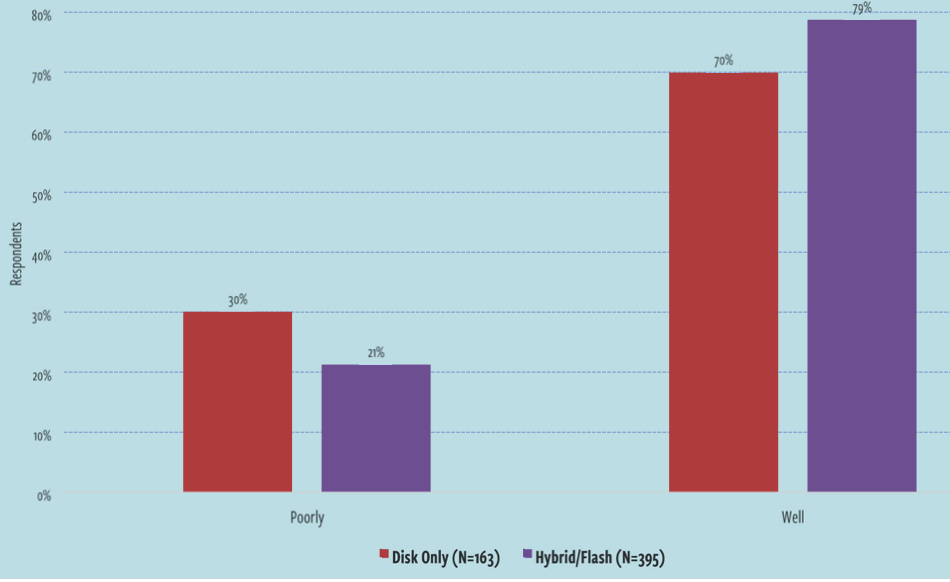
Oracle is one of those applications that generally requires a lot of I/O capability so we would expect to see that people using flash in some way are having a better experience than those running all disk, results of which are borne out in Figure 7. In that figure, you can see that those running hybrid and flash storage systems have substantially fewer performance complaints than those running all disk systems.
Workload Performance: Oracle
Figure 7: Workload performance assessment: Oracle
VDI
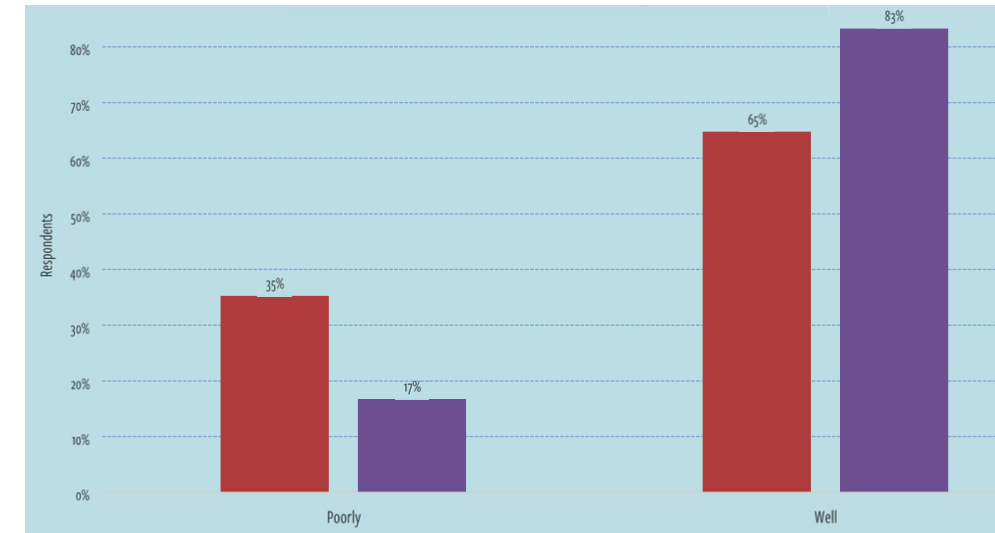
Virtual desktops have been talked about for a long time now. In the early days of VDI, storage proved to be a major roadblock for many would-be adopters of this virtualization technology. As flash as hit the market, though, this all began to change. Flash became a primary enabler for this technology and the reasons why are easily seen in Figure 8. The delta between people’s experience running VDI in all-disk environments as opposed to environments with flash storage is significant.
You will also notice that the difference in experience for those running hybrid or flash systems is better than for those running all-disk systems. For many, VDI has been an original use case for moving to newer storage.
Workload Performance: Desktop Virtualization
Figure 8: Workload performance assessment (VDI)
Big Data
Figure 9 displays respondents’ experiences running big data applications. Here, you can see that flash does provide a modest performance advantage over disk. Bear in mind that big data applications are often analytical in nature and require high levels of I/O in order to operate. With this in mind, it makes sense that flash would provide a major advantage. In fact, 79% of respondents on flash say that their big data workloads run well.
Workload Performance: Big Data
Figure 9: Workload performance assessment: big data
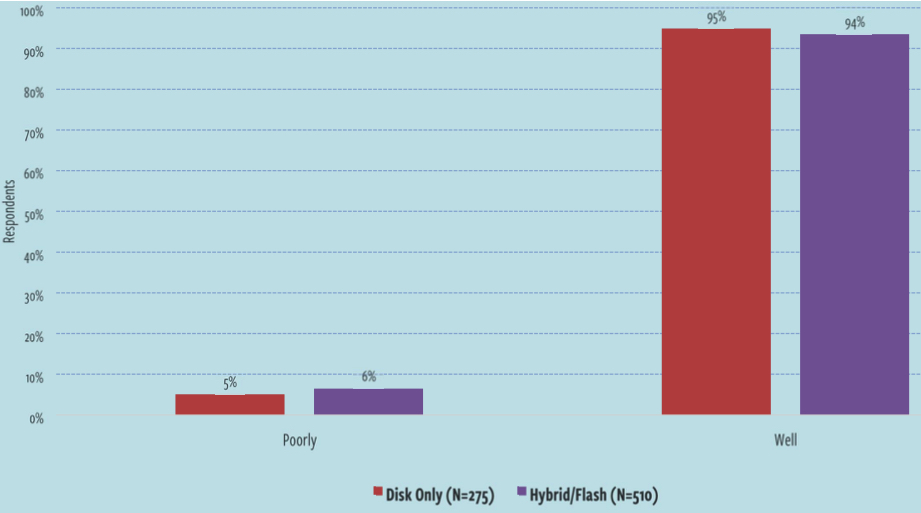
File Server
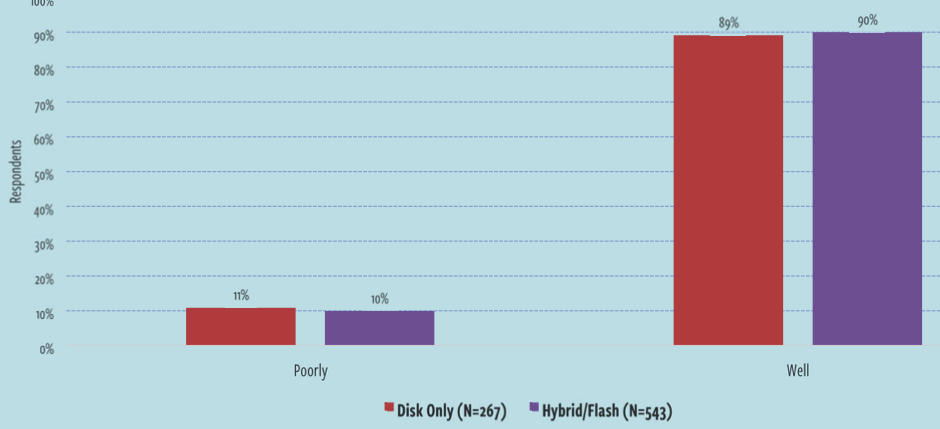
Figure 10 shows that just about all respondents, regardless of the type of storage they’re running, have a positive experience in terms of performance and that there is absolutely no difference in performance outcomes when comparing disk and flash environments.
Workload Performance: File Server
Figure 10: Workload performance assessment: file server
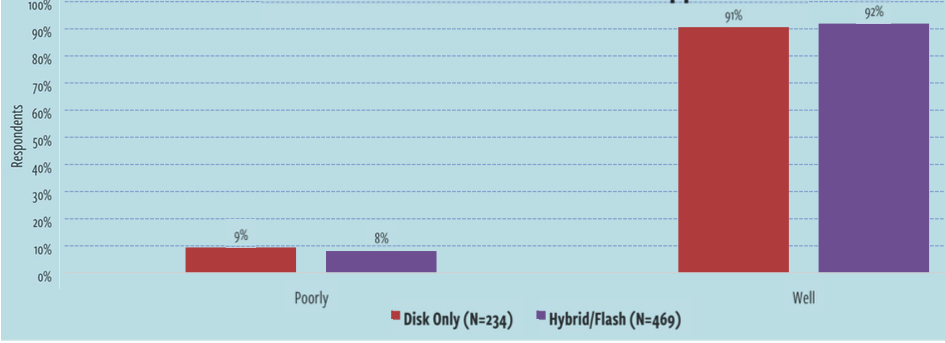
Microsoft Applications
In Figure 11, you can see that those running flash systems have a slightly better experience than those running all-disk systems, but only by the smallest of margins. Microsoft applications (Exchange/SharePoint, Figure 11) appear to be running pretty well for most respondents, regardless of the type of underlying storage that’s in use. The same holds true for SQL Server (Figure 12).
Workload Performance: Microsoft Applications
Figure 11: Workload performance assessment: Microsoft applications
Workload Performance: SQL Server
Figure 12: Workload performance assessment: SQL Server
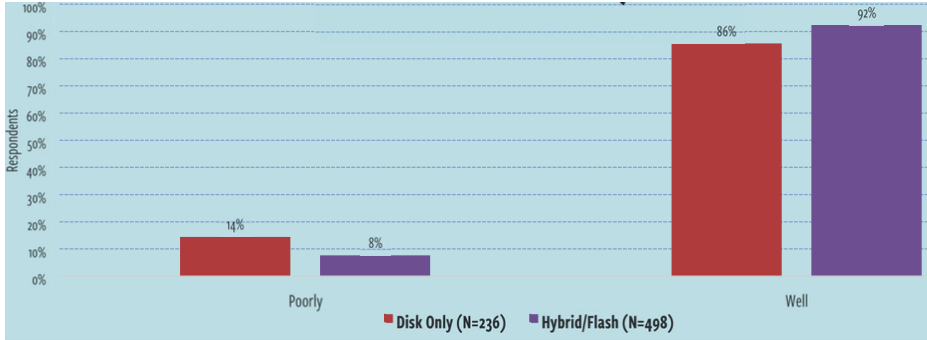
Server Virtualization
Figure 13 shows us that the performance perception differences between disk and flash users for storage virtualization is relatively insignificant. Most respondents running all-flash systems say that their environments run very well – and by a pretty reasonable margin – but we don’t see that many complaints from those running all-disk, either. Upon reflection, given the ubiquity of server virtualization, most respondents are sizing their storage environments around this use case, so, with that line of thought, it would make sense that the underlying storage type would not have a very negative impact on perceived performance.
Workload Performance: Server Virtualization
Figure 13: Workload performance assessment: server virtualization
Data Protection
We wanted to determine whether the introduction of flash storage induced positive – or negative – changes in the data center. Data protection is one of the most important functions supported by IT. Without adequate data protection capabilities, the organization runs serious risk in the event of a data loss situation or outage.
Although data protection is often considered a separate service from storage, the two are very much intertwined. Further, over time, more and more storage vendors have brought to their platforms varying levels of data protection capabilities. We asked survey respondents about their experience with regard to their ability to meet critical data protection SLAs. We asked this question in a couple of different ways in order to be able to draw some conclusions about the impact that the implementation of flash storage has on this need.
Figure 14 gives a look at these results. Here, ‘better’ means that the bars at the left side of the chart go higher.
This shows that meeting data protection SLAs is easier:
- The red bars display results for those still fully on disk
- The purple bars show those that are on flash asked their experience prior to
deploying flash - The orange bars show how those that have moved to flash systems now view their ability to meet data protection SLAs
It’s abundantly clear that those that have deployed flash feel that it’s now easier to meet data protection SLAs. 66% of those on flash say that it’s easy to meet these SLAs. Just 40% of those still running on disk feel the same way. It’s interesting to see that those that reminisce about their pre-flash days (purple bar) felt that they had major difficult meeting data protection SLAs, with only 29% able to meet their goals.
What this chart doesn’t reveal is the why behind people’s feelings on this topic. It could be that the performance of flash has enabled new capabilities that were simply not possible with all disk. Or, it could be that the flash-enabled storage systems have more comprehensive data protection capabilities than their old disk-based systems featured. Regardless of reason, it’s a good news situation that flash deployment has helped these organizations feel that they are better equipped to support data protection needs.
Difficulty Meeting Data Recovery SLAs
Figure 14: Difficulty meeting data protection SLAs
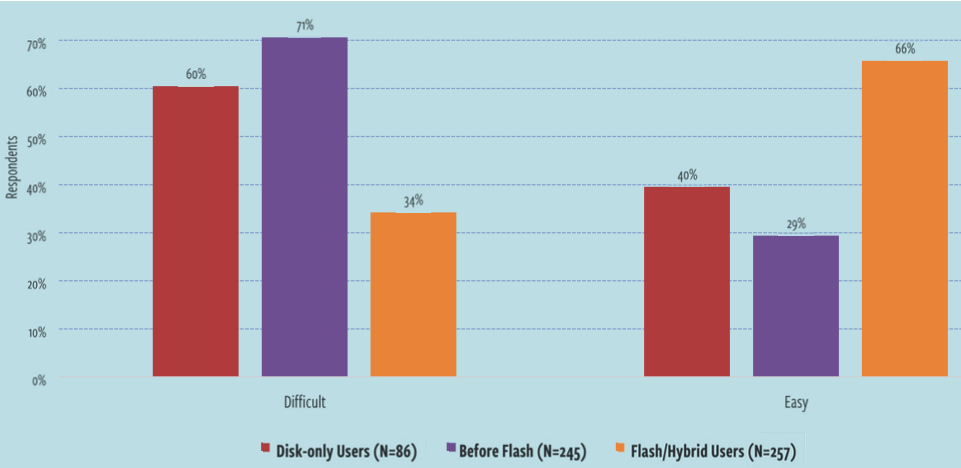
Note: In this chart, ‘Before Flash’ refers to respondents’ experience prior to running on hybrid or all flash storage. ‘Disk-only Users’ refers to those respondents that are still running 100% disk-based storage environments. Both are all-disk metrics, but one counts people currently running all disk.
Snapshots Usage
Storage snapshots have become increasingly popular as one aspect of an organization’s comprehensive data protection strategy. However, in some scenarios, snapshots can impose unacceptable performance penalties in the storage infrastructure. Different types of snapshots carry with them different levels of impact.
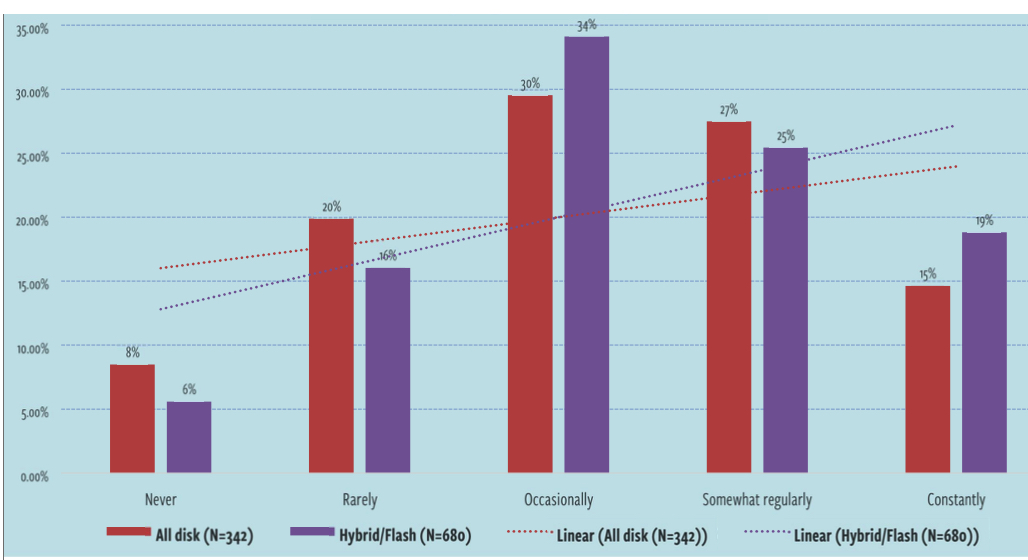
In Figure 15, it’s easy to see that the snapshot usage trend line angles in favor of respondents using snapshots more frequently than those that continue to run storage environments based on just spinning disk. In other words, those using flash in some way are also more likely to use snapshots on a more regular basis than those on spinning disk.
Frequency Use of Storage Snapshots (longer is better)
Figure 15: Frequency of use of storage snapshots
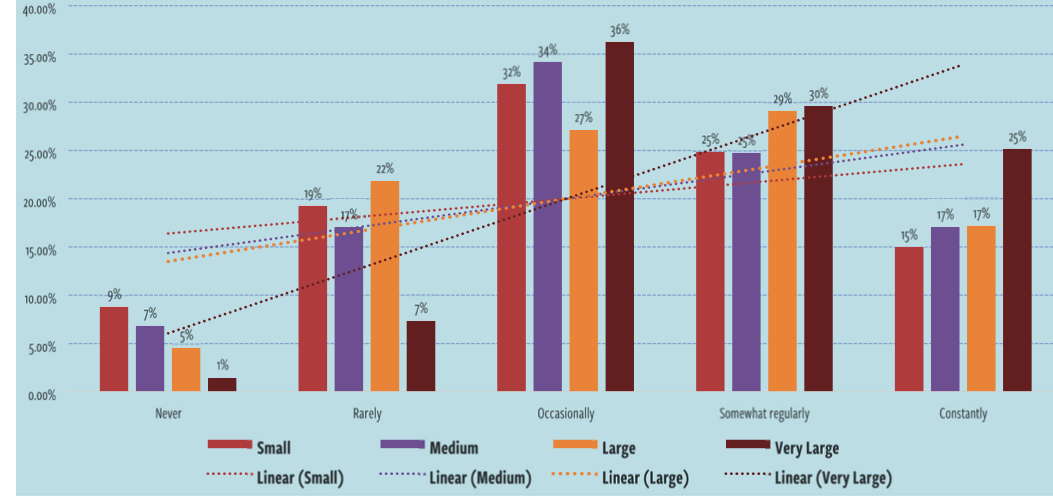
There are other factors at play when to comes to the use of storage snapshots, however. While it appears that those that have adopted flash do, in fact, use snapshots more often than those running disk, Figure 16 makes it clear that company size is a large factor in predicting the use of snapshots. In fact, as you run the scale of company size, the linear trend lines (dotted lines in the chart) perfectly demonstrate this reality.
In Figure 16, you can see that close to 55% of very large companies (20,000+ employees) use snapshots either regularly or constantly. For small companies (those with fewer than 500 employees), this number is just 40%.
Frequency Use of Storage Snapshots (by company size) (longer is better)
Figure 16: Frequency use of storage snapshots by company size
Data Protection Features and Outcomes
Platform capabilities dictate what kinds of data protection opportunities organizations will be able to leverage. To better understand the kinds of features that companies have in their platforms, we asked responents about some specific capabilities.
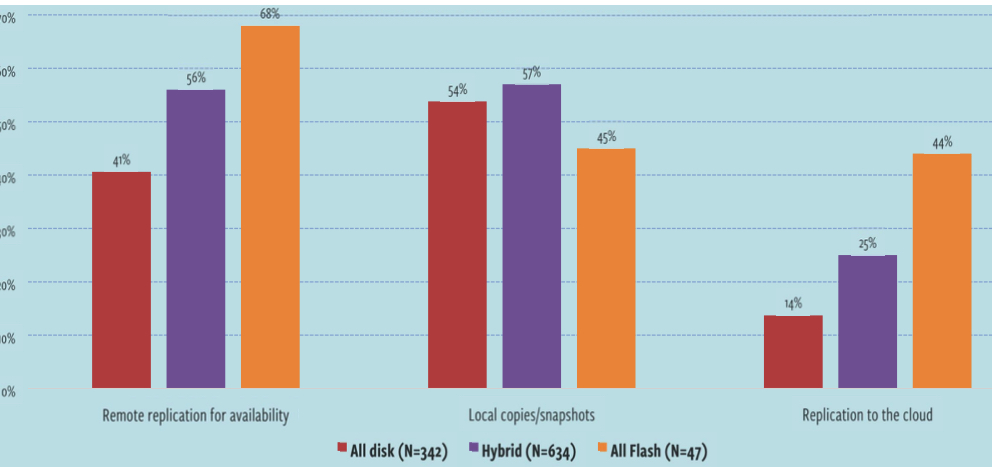
It’s absolutely safe to say that those that have adopted flash have at their disposal a much wider set of capabilities that they can leverage to improve the organization’s data protection stance. With the exception of traditional backup applications and snapshots, those running flash are far more likely to have other features, including remote replication, and replication to the cloud. Local copies/snapshots is a bit lower for all flash users here, but we believe that this is more than likely due to these features possibly not being used by those users rather than not being present.
Snapshots are often seen as a default feature in many of today’s storage systems and, with that in mind, may not be specifically sought out. That may explain the reason for a perception that a flash storage system may not have snapshots. It’s also possible that users equate not using snapshots to not having the capability.
Types of Storage-Based Data Technologies in Place
Figure 17: Data protection capabilities present in existing storage systems
Even with all of the features you saw in Figure 17 some companies don’t do a great job at the recovery side of the equation. Data protection is only as good as the recovery side. Unfortunately, all too often, companies discover too late that their carefully crafted data protection systems don’t so what they were intended to do and the company either loses data or is down for an extended period of time. Neither situation is palatable and both can end up costing the company significant sums of money.
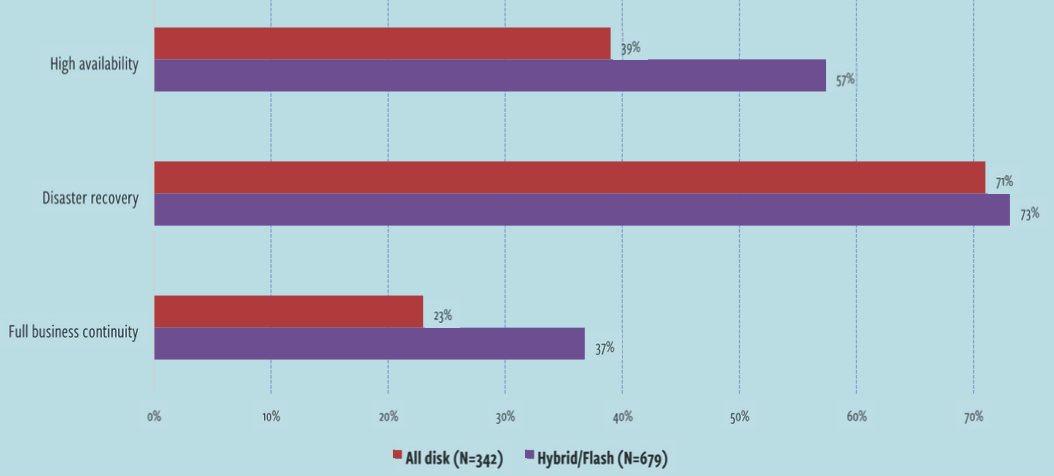
To understand if those that are running flash are better protected – or at least think they are better protected – we asked respondents to describe the outcomes that they are expecting to see with their replication/data protection efforts. As you can see in Figure 18, those running flash are supporting most outcomes more fully than those running all disk systems. This is especially true when it comes to HA and full BC capabilities.
Bear in mind that these results do not necessarily mean that the storage system itself is providing these outcomes on its own. It’s entirely possible – and even likely – that the storage system is just one part of a larger strategy that enables these outcomes. We suspect that the speed of the platforms that include flash coupled with enhanced replication capabilities found in modern platforms contribute to the outcomes shown in Figure 18.
Outcomes Being Supported With Data Replication Efforts
Figure 18: Outcomes being supported with replication features
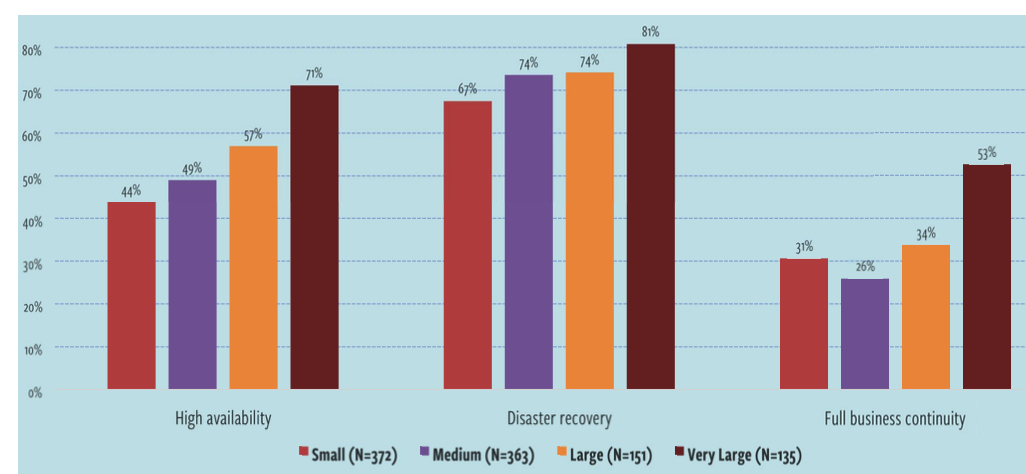
In general, company size is also an indicator for the kinds of outcomes that are being supported by a storage system’s replication capabilities. Figure 19 shows you the breakdown of outcomes by company size.
It’s interesting to see that small companies (less than 500 employees) are undertaking full BC efforts at a rate (31%) that is higher than medium (26%) companies. It’s no surprise that very large companies are far and away ahead of the pack here at 53%.
DR efforts are aligned by company size as well, although there is not a large delta between the company sizes here. HA is another area in which very large companies are well ahead of the rest of the pack, coming in at 71%, a full 27% ahead of small companies.
Outcomes Being Supported With Data Replication Efforts (by company size)
Figure 19: Outcomes being supported with replication features (by company size)
Data Reduction
As the world moves inextricably closer to 100% flash, the role of data reduction takes on new importance. There are a number of flash-based storage solutions sold on the market today that describe the amount of storage in terms of ‘effective capacity.’ In layman’s terms, this means that those vendors are selling storage systems with implicit assumptions about the kind of data reduction.
Data reduction Features
Data reduction has always been important, but, for various performance-related reasons, has not always been feasible. Further, the term data reduction is often confusing to people as it can consist of a number of different features coming together to improve the overall capacity efficiency of a storage system.
- Data deduplication. As data is written to a storage array, every block is ‘fingerprinted’ and compared to existing blocks on the array. If that block already exists, the data is not saved a second time. If the block doesn’t already exist, it’s written to the array. This technique can save substantial capacity with highly duplicative workloads, such as virtual desktop environments.
- Compression. You can think of compression as a ZIP-like operation in that it simply makes files smaller. Deduplication prevents multiple copies of data from existing on the array while compression makes existing files smaller.
- Thin provisioning. While not really a technique that makes data smaller, thin provisioning allows administrators to logically and dynamically allocate storage capacity without having to physically allocate all of it from the storage system. For example, if an administrator creates a 10TB volume, but only 1TB of that capacity is needed, only 1TB will be allocated. As data grows, more capacity is physically allocated to meet capacity needs.
Systems with flash often have a combination of one of more of these reduction features. Some may even have all three. Back in the days of disk, reduction technologies were not as prevalent as they have become today. This is partially due to the fact that reduction – especially deduplication and compression – can be a processor-intensive operation. Older processors were not always up to the task.
With flash, though, especially before the price of flash media dropped, having the ability to reduce data capacity was a key requirement in order to get flash storage economics to a reasonable level.
You can look at storage economics in two ways:
- Capacity. Capacity is measure in dollars per gigabyte or terabyte. Here, raw (unreduced) spinning disk still wins the day, although the cost of raw flash has continued to drop and is expected to reach parity with raw disk in the not-too-distant future. Data reduction, however, has enabled flash storage system vendors to compete with disk on capacity-based pricing.
- IO/s performance. For many applications, the key financial metric is one related to performance. How much does it cost for the application to perform as necessary? Often expressed in terms of dollars per I/O, flash storage is generally far less expensive than spinning disk when it comes to this measurement.
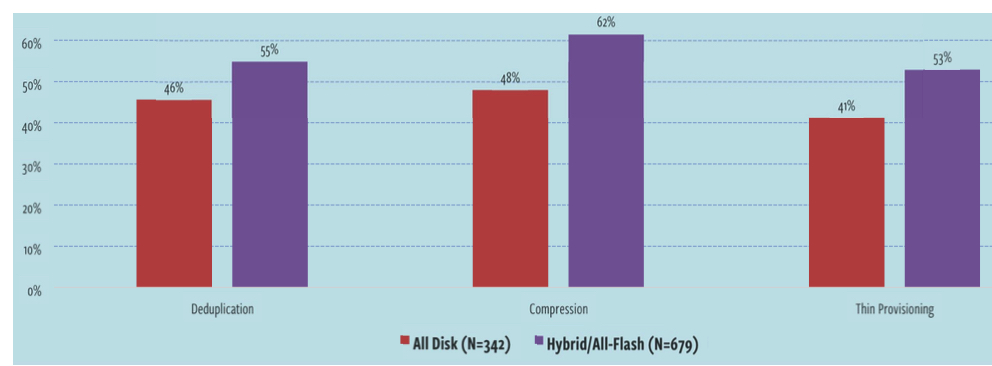
Figure 20 shows you that those that have deployed flash are far more likely to have comprehensive data reduction capabilities available. 55% of respondents using indicate that they have deduplication while 62% say that they have compression features.
Data Reduction Capabilities Provided by Existing Solution
Figure 20: Data reduction capabilities provided by existing solution
Data Reduction Ratios
Having data reduction available is certainly beneficial as it can drive down the cost of storage. When vendors wish to describe the capacity of their storage systems with reduction technologies included, they often talk about the ‘effective capacity’ of the platform. So, they may say that their platform is ‘less than $1GB effective.’
What does this mean in reality? In general, data reduction is expressed as a ratio. For example, if reduction has enabled you to effectively triple the capacity of your storage system, that would be expressed as a ‘3:1 reduction’ ratio. Different kinds of workloads reduce differently. For example, if you’re running a medical imaging company, you probably won’t see a lot in the way of reduction since all of the data is very unique and is probably already compressed. If, on the other hand, you’re running a large VDI environment, you will probably see a very high reduction ratio since all of those virtual desktops are virtually identical, thereby benefitting from data deduplication.
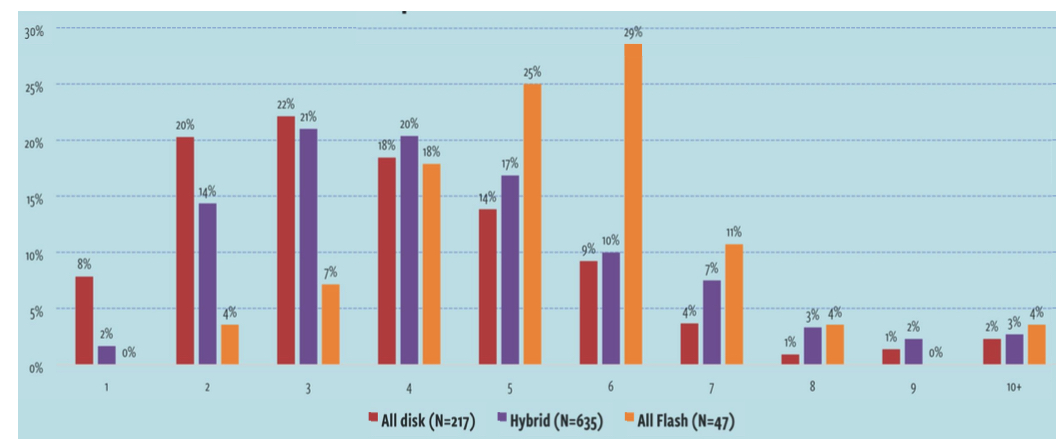
Now, the big question is this: just how much reduction are people actually seeing in their storage environments? That’s what we’re going to see now in Figure 21. Here, you can see that those running hybrid storage are seeing noticeably better reduction rates than those running on all-disk systems while those running all-flash systems are doing extremely well when compared to either all-disk or even hybrid.
Reported Data Reduction Ratios
Figure 21: Reported respondents data reduction ratios in existing storage environments
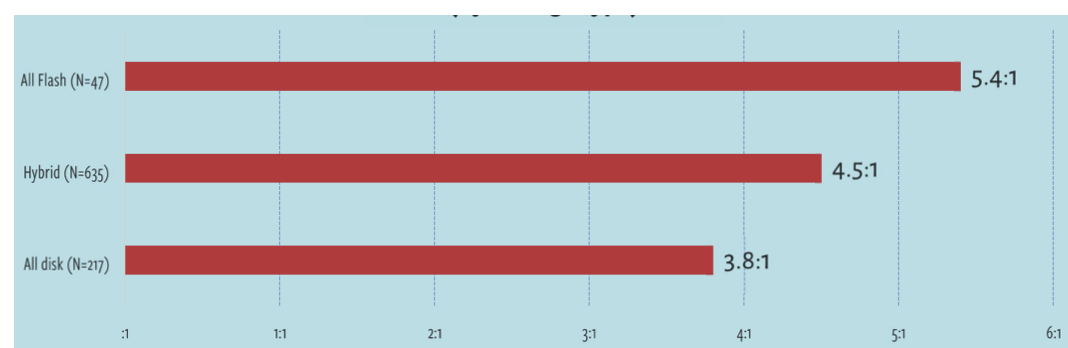
Our survey respondent average reduction, as you would expect, is dependent on storage type and is shown below in Figure 22. As you can see, respondents running all-flash storage are seeing average reduction rations of a whopping 5.4:1 While those running all-disk are seeing a ratio of 3.8:1. This is a 39% difference and is extraordinarily important when it comes to determining the overall economics of a storage solution. Although that 39% improvement is significant, we were still somewhat surprised to see a 3.8:1 average reduction ratio reported by all-disk users. Bear in mind that only those actively using deduplication and/or compression had the opportunity to answer this question. If we were to include those all-disk users that have no reduction capabilities in the calculations, that 3.8:1 figure would plummet. We also surmise that some respondents may have included thin provisioning in their calculations. Regardless, those running all-flash systems have a far better reduction experience than those running all-disk and even hybrid systems.
Average Data Reduction Ratio (by Storage Type)
Figure 22: Average data reduction broken out by storage type
QoS
In order for storage systems to be able to maintain performance levels necessary to meet workload needs, many storage vendors have implemented QoS features, which, for example, allow an administrator to set limits on how many IO/s can be consumed by a client or on a volume. They can also configure clients and volumes with a guaranteed level of performance for applications that require a lot of I/O.
As we sought to find out what really changes when respondents make the jump from disk to flash-based systems – including hybrid systems – we wanted to understand where QoS falls on the spectrum and asked respondents for their thoughts on the level of importance when comparing disk to flash.
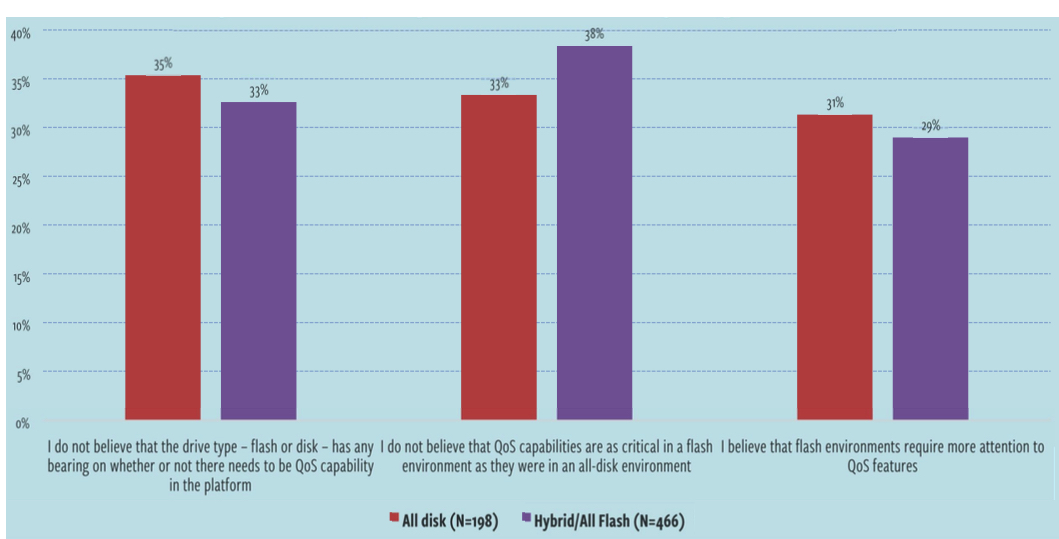
Even when broken down by the type of storage environment, as shown in Figure 23, there is very little variation in how respondents view QoS. This doesn’t mean that QoS isn’t important. This data result simply means that respondents’ thoughts on QoS don’t change when they make the transition from disk to flash environments. Note that we also allowed respondents to indicate that they have no thoughts or opinion on this topic. The results in Figure 23 do not include those responses.
Importance of QoS When comparing Disk to Flash
Figure 23: Importance of QoS capabilities
Operational Environment
Physical Footprint
A lot of marketing money has been spent by vendors working to convince flash storage buyers that they can reduce the physical footprint of their storage environments by adopting flash storage. In other words, they can use less rack space than they had to use when they were running all disk environments. This guidance stems from a couple of areas.
First, there have been organizations that, in order to combat storage performance problems in their all disk systems, were forced to ‘throw hardware at the problem.’ These companies didn’t need more capacity, but they did need more IO/s, so they were forced to ‘add spindles” – code for adding arrays of HDDs – just to have more spindles across which to spread workloads. This is an expensive way to add capacity since it requires buying more hardware, which also requires more rack space as well as more power and cooling. So, there is definitely good reason to suspect that a move to flash can help to reduce footprint.
Further, let’s consider reduction. If you’re running an all-flash storage environment and you’re getting the average 5:1 data reduction rate, that means that you need just one-fifth of the capacity that you would need if you didn’t have data reduction. The need for less capacity means that you probably need fewer shelves of storage.
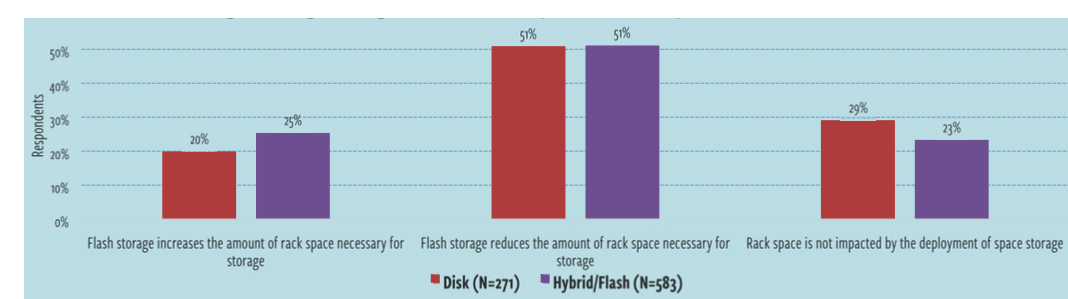
Figure 24 (next page) demonstrates that those that have deployed flash have a slightly higher belief that flash storage increases the amount of rack space that’s necessary for storage. 20% of respondents running disk systems and 25% running flash systems believe that they will increase their use of rack space.
Here’s the major caveat: did these customers actually replace their old storage with flash storage or did they augment their old storage with flash storage? If it was the latter – they simply added flash to support key workloads – there would not have been a decrease in rack space usage.
Thoughts Regarding How Flash Impacts Rack Space in Data Center
Figure 24: Respondent thoughts regarding rack space between flash and disk
Power and Cooling
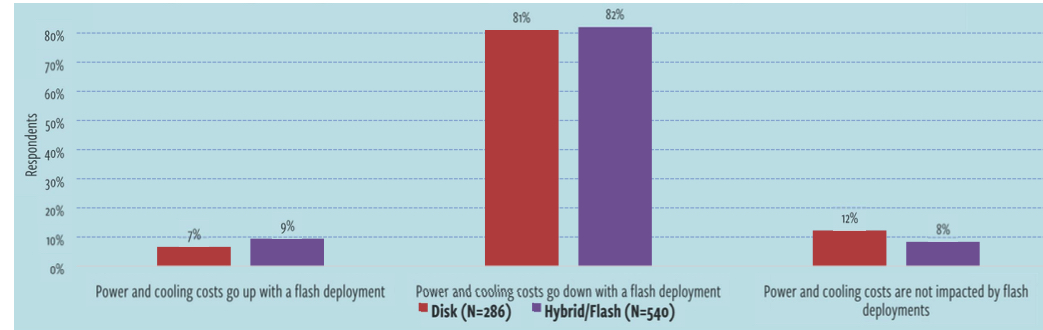
One of the economic benefits that has been discussed with regard to flash revolves around the idea that power and cooling costs go down once flash is deployed. After all, flash disks have no moving parts and, thus, generate less heat, which results in less cooling need. It can be an economic boon for large organizations that have a lot of storage.
When looking at the primary storage breakdowns we’ve been using throughout this report – shown in Figure 25, it appears that general wisdom on this topic very much holds true and power and cooling costs in the data center do, in fact, decrease. The fact that the numbers in all three scenarios in Figure 25 are so close between the all-disk respondents and those that have deployed flash in some form indicates that the guidance that has been provided by vendors is generally true. The vast majority of all-disk respondents believe that power and cooling costs will go down. The vast majority of those that have actually deployed hybrid and all-flash systems report that this has been their experience.
Thoughts Regarding How Flash Impacts Power and Cooling in Data Center
Figure 25: Respondent thoughts regarding the cost of power and cooling differences between flash and disk
Impact on Replacement Cycle
Most organizations have established replacement cycles for the various and sundry equipment types present in the data center. The replacement cycle dictates how long you will keep a piece of equipment in place before you replace it with newer hardware.
Replacement cycles are driven by these key factors:
- Manufacturer warranties and support contracts. As long as a vendor is still supporting a particular equipment model and can provide replacement parts and as long as that hardware is meeting the needs of the business, it may stay in production.
- Business needs. If the equipment has hit the end of its cycle and is no longer meeting the needs of the business, it might be replaced even if it’s still being supported by the vendor. Flash largely solves this issue, at least from a performance perspective. It’s not that likely that an organization will be forced to upgrade a flash system for performance reasons.
- Depreciation schedules. Some organizations base their replacement schedules solely on depreciation schedules for various types of equipment. Once the equipment is fully depreciated, it’s replaced and the depreciation schedule begins anew.
Thoughts on How Flash Storage Impacts Storage Equipment Refresh Cycle
Figure 26: Respondent toughts on flash vs. disk replacement cycle difference
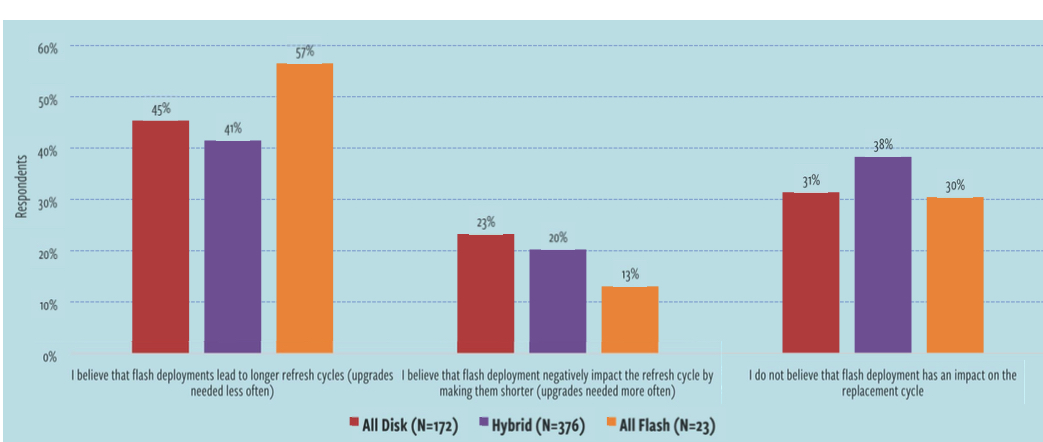
With flash storage, we wanted to determine how people are viewing replacement decisions as compared to disk. Figure 26 is the culmination of that effort and, as you can see, a whole lot of respondents – whether they’re currently all disk or are running some flash – feel that a move to flash can potentially lengthen replacement cycles. From a budget perspective, this can be a major win and can bring down amortized annual cost for storage in a significant way. 45% of those running disk and 41% of those on hybrid storage today believe that they can increase the length of their replacement cycles. However, a full 57% of those running all-flash systems believe that they will be able to extend their refresh cycles.
Just 20% or so of respondents believe that a move to flash will have an adverse impact on replacement cycle and the balance don’t see the length of the replacement cycle changing due to the type of disk in use.
Respondents certainly still have concerns around flash, though. Even though many believe that flash has the potential to increase the length of the replacement cycle, there is some concern around flash endurance. As you may already know, unlike spinning disk, flash media has a finite lifespan measured in program/erase cycles. Each time a flash cell is subjected to the program/erase cycle, it loses some of its ability to hold a charge. Eventually, that cell will simply wear out and become unusable. Early in the days of flash storage, this was a serious concern and, between this issue and the massive expense, flash was not seen as a serious enterprise contender.
All of that has changed. Today, flash pricing has plummeted. On the endurance and reliability front, both flash disk manufactures and storage system vendor have invested tremendous energy in addressing the longevity issue. There are now complex processes happening under the hood of flash storage systems that largely eliminate the reliability issue.
There is also the idea of simply refreshing technology rather than going through an outright replacement. One respondent had this comment in response to the technology refresh cycle: “With advances and changes in flash (i.e. new 15TB SSDs ), I can see the refresh happen less often, but the upgrades occurring more often.” In other words, this respondent understands that technology will continue to advance. In the world of flash, as long as the existing system can accept newer media, it may not be necessary to replace the whole chassis or cabinet. Instead, you may be able to simply upgrade or add storage to what you already have.


 Subscribe to our free daily newsletter

