


EMEA External Disk Systems Up 2% in 2013 – IDC
EMC +3%, IBM -5%
This is a Press Release edited by StorageNewsletter.com on March 18, 2014 at 3:14 pmThe external disk storage systems market value in Europe, the Middle East, and Africa (EMEA) recorded another slight recovery from the previous quarter growing 3.4% annually in 4Q13 to $2.09 billion, according to the latest EMEA Quarterly Disk Storage Systems Tracker from International Data Corporation.
The dollar per gigabyte trend returned to previous levels, with 24.5% decline year on year, boosting the consumed storage capacity by 37% to 2.5EBs. For the full year, external storage spending registered slow growth of 1.7% triggered by Western Europe market improvement in the second half of the year.
Western Europe
Western Europe (WE) registered a single-digit positive performance in revenue for the second quarter in a row compared to the same period a year ago to achieve $1.51 billion for the quarter. This growth, albeit still tepid, should put an end to the declining path that characterized 2012, sparking hopes of an ongoing recovery for the region.
From a yearly point of view, in 2013 WE resumed growth again after the drop in spending that characterized the external storage market in 2012, due to tighter budgets and to some verticals and large companies probably being over-dimensioned in terms of IT systems.
Germany and the UK were confirmed as the driving markets for storage, together accounting for nearly 50% of the total WE market. In sharp contrast with them, France, the third largest market in WE, lagged behind, continuing to decline due to poor investments especially in the private sector. Notably, some previously battered economies such as Spain and Ireland are eventually finding their way towards recovery.
CEMA
As predicted by IDC, Central and Eastern Europe, the Middle East, and Africa (CEMA) overcame the negative trend from the previous quarter and grew 4.2% in terms of value to reach $574.52 million.
Central and Eastern European (CEE) countries were still not be on a par with 4Q12 results, and declined 2.6% year on year, but spending in the Middle East and Africa (MEA) reached double-digit growth of 12.8%.
“In 2013, the CEE storage market could not keep up with the positive results from the last couple of years, due not only to slow economic recovery but also to political and social unrest in many of the countries. At the same time, MEA, being the growth follower until recently, managed to drive the entire CEMA region up on the back of strong demand in Africa and the GCC region and the finalization of delayed large projects in the last quarter of the year,” said Marina Kostova, storage systems analyst, IDC CEMA.
Vendor Highlights
Vendor ranking remained largely unchanged in EMEA in 4Q13 compared to the same period a year ago, featuring EMC, IBM, HP, NetApp and Dell as the top 5 storage companies in terms of revenue.
EMC retained first position and increased its share to almost 29%. However, the quarter registered a mixed performance across the top-ranked vendors.
HP experienced strong double digit growth with particularly good results in Western Europe as 3PAR continued its upward trend reaching 45% of the vendor’s entire storage revenue and backup StoreOnce solutions recorded best ever performance in EMEA.
Dell followed in terms of performance, proliferating across all sub regions but mainly in MEA due to a combination of Compellent sales, acceptance of the EquaLogic unified solution and progress with flash.
NetApp was still third and managed to increase market share, adapting to the different market dynamics in CEMA.
On the other hand, IBM and HDS closed a more disappointing quarter as the former lost positions in EMEA as a whole while the latter suffered mainly from its declining high-end sales in WE.
On a yearly basis, the performance of major vendors in EMEA also varied, with EMC, NetApp and Dell recording single-digit growth while IBM and HP could not reach the value levels from 2012.
Value Growth for EMEA External Disk Systems Vendors in Revenue
| Vendor | 4Q13 Y/Y Growth | 2013 Y/Y Growth |
| EMC | 5.64% | 3.15% |
| IBM | -11.54% | -4.52% |
| HP | 18.93% | -1.08% |
| NetApp | 5.46% | 4.72% |
| HDS | -5.91% | 1.37% |
| Dell | 9.52% | 3.42% |
| Other Suppliers | 4.18% | 4.47% |
| Total | 3.37% | 1.73% |
(Source: IDC, 2014)
Market Highlights
From a price band perspective, 4Q and the whole of 2013 were characterized by a major shift away from the high end and towards the midrange, under the effect of still tight budget constraints among clients. The midrange in fact became the driving segment in 2013 overall, having gained more than a percentage point of share of the high end compared to 2012 (responsible for more than 50% of the market in EMEA).
“Even though midrange segment was the fastest growing, the intense competition and the limited space for optimization on the hardware level forced storage vendors to focus on propositions around cloud, converged solutions, and software defined storage,” said Silvia Cosso, storage systems analyst, IDC Western Europe. “These trends, together with flash-enabled storage, were the factors shaping the market in 2013 and they will continue to do so.“
Top 5 EMEA External Storage Disk Market Share, From 4Q12 to 4Q13 Revenue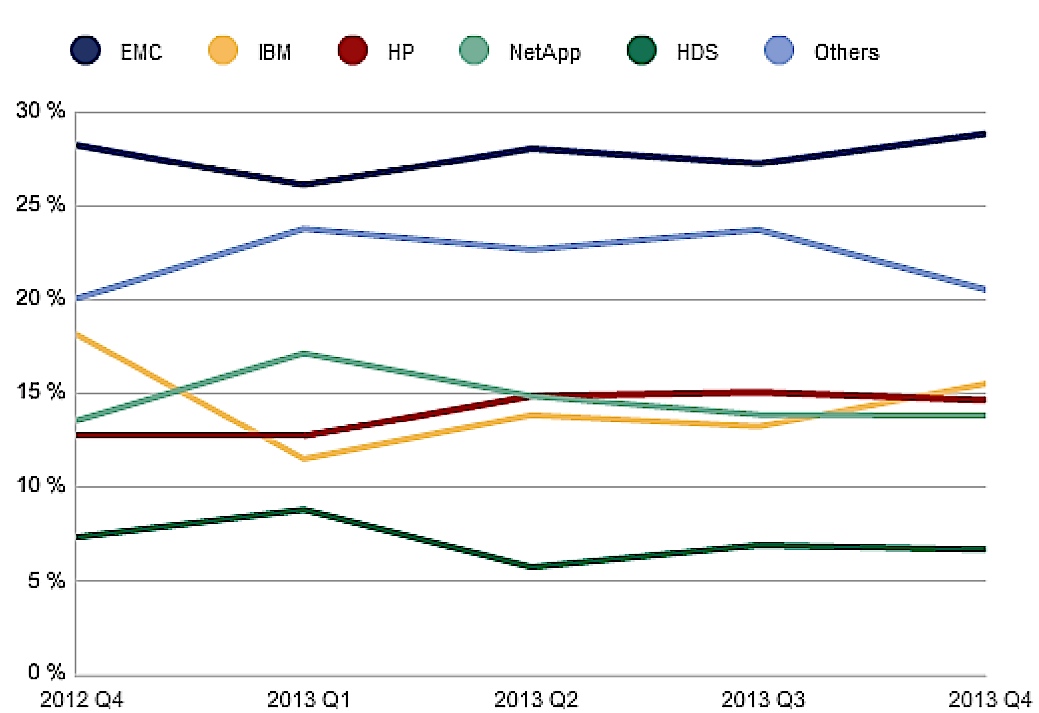
(Source: IDC, 2014)
Taxonomy Notes:
- IDC defines a disk storage system as a set of storage elements, including controllers, cables, and (in some instances) HBAs, associated with three or more disks. A system may be located outside of or within a server cabinet and the average cost of the disk storage systems does not include infrastructure storage hardware (i.e. switches) and non-bundled storage software.
- The information in this quantitative study is based on a branded view of the disk storage systems sale. Revenue associated with the products to the end user is attributed to the seller (brand) of the product, not the manufacturer. OEM sales are not included in this study.
- IDC’s EMEA Quarterly Disk Storage Systems Tracker is a quantitative tool for analyzing the Europe, Middle East, and Africa disk storage market on a quarterly basis. The tracker includes quarterly shipments and revenues (both customer and factory), terabytes, $/GB, GB/unit, and average selling value. Each criterion can be segmented by location, installation base, OS, vendor, family, model, and region.


 Subscribe to our free daily newsletter
