


8.6ZB of Data Center Traffic Predicted for 2018 – Cisco
53% of all residential Internet users to use personal cloud storage, averaging 811MB/month
This is a Press Release edited by StorageNewsletter.com on November 14, 2014 at 2:59 pmIn its fourth annual Cisco Global Cloud Index (2013 – 2018), Cisco Systems, Inc.www.cisco.com forecasts continued strong growth of cloud traffic, cloud workloads and cloud storage with private cloud larger than public cloud.
Over the next five years, the study projects data center traffic to nearly triple, with cloud representing 76% of total data center traffic. By 2018, half of the world’s population, projected to be 7.6 billion people (source: United Nations), will have residential Internet access, and more than half of those users’ (53%) content will be supported by personal cloud storage services.
Global Data Center Traffic
The study predicts that global data center traffic will nearly triple from 2013 to 2018 with a CAGR of 23% growing from 3.1ZB/year in 2013 to 8.6ZB/year in 2018.
The 8.6ZB of data center traffic predicted for 2018 is equivalent to streaming all of the movies (approximately 500,000) and television shows (3 million) ever made in ultra-high definition 250,000 times.
Global cloud traffic is growing faster than the overall global data center traffic. In 2013, cloud accounted for 54% of total data center traffic, and, by 2018, cloud will account for 76% of total data center traffic.
Data center traffic includes data center-to-user traffic along with data center-to-data center traffic and traffic that remains within data centers.
Consumer Cloud Storage
By 2018, 53% of all residential Internet users globally will use personal cloud storage, and the average consumer cloud storage traffic per user will be 811MB/month by 2018, compared to 186MB/month in 2013.
Personal Cloud Storage – Growth in Users
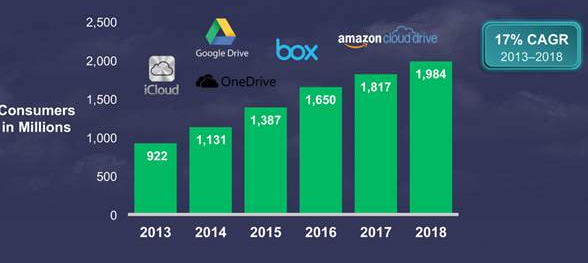
(Source: Cisco Global Cloud Index, 2013–2018; Juniper Research)
Private vs. Public cloud Adoption and Growth
“When people discuss cloud, they often focus on public cloud services or public cloud storage services. However, a very significant majority of today’s cloud workloads are actually processed in private cloud environments. Even with public cloud workloads having significant growth, by 2018, almost 70% of cloud workloads will still be private cloud-related, requiring the ability of workloads to bridge across a hybrid private/public cloud environment,” said Kelly Ahuja, Cisco, SVP, service provider business, products and solutions.
By 2018, 69% (113.5 million) of the cloud workloads will be in private cloud data centers, down from 78% (44.2 million) in 2013, and 31% (52 million) of the cloud workloads will be in public cloud data centers, up from 22% (12.7 million) in 2013.
Global Cloud Readiness
The number of countries deemed ‘cloud ready’ continues to grow. Last year (2013), 79 countries met the single advanced application criteria for fixed network; this year (2014), that number grew to 109 countries. Last year (2013), 42 countries met the intermediate single application readiness criteria for mobile networks; this year (2014), that number grew to 52 countries.
To assess cloud readiness, average and median upload/download speeds and latencies were calculated based on global fixed and mobile network speed test analyses.
Basic Cloud Apps / Network Requirements
- Download speed: up to 750kbps; upload speed: up to 250kbps; latency: above 160ms
- Sample consumer basic services: stream basic video/music, text communications, web browsing
- Sample business basic services: web conferencing, cloud-based learning management system, VoIP
Intermediate cloud Apps / Network Requirements
- Download speed: 751-2,500kbps; upload speed: 251-1,000kbps; latency: 159-100ms
- Sample consumer intermediate services: smart home, personal content locker (multimedia), HD video/ music streaming
- Sample business intermediate services: ERP/CRM, IP audio conferencing, videoconferencing
Advanced Cloud Apps / Network Requirements
- Download speed: >2,500kbps; upload speed: Higher than 1,000kbps; latency: <100ms
- Sample consumer advanced services: connected education, connected medicine, HD video chat
- Sample business advanced services: virtual office, HD audio conferencing, HD videoconferencing
The countries with the leading fixed network performance in 2014 are (in alphabetical order) Hong Kong, Japan, Korea, Luxembourg, the Netherlands, Romania, Singapore, Sweden, Switzerland and Taiwan.
The countries with the leading mobile network performance in 2014 are (in alphabetical order) Australia, Belgium, China, Denmark, Korea, Luxembourg, New Zealand, Oman, Qatar and Uruguay.
Index Overview:
- The Cisco Global Cloud Index (2013-2018) was developed to estimate global data center and cloud-based traffic growth and trends. Itx serves as a complementary resource to existing IP network traffic studies such as the Cisco Visual Networking Index, providing insights and visibility into emerging trends affecting data centers and cloud architectures. The forecast becomes important as the network and data center become more intrinsically linked in offering cloud services.
- The index includes a ‘workload transition’ forecast, which shows the workload shift from moving from traditional data centers to more virtualized cloud servers.
- The forecast also includes a supplement on Cloud Readiness Regional Details, which examines the fixed and mobile network abilities of each global region (from nearly 150 countries) to support business and consumer cloud-computing applications and services.
- The index is generated by modeling and analysis of various primary and secondary sources (complete methodology details are provided in the report).


 Subscribe to our free daily newsletter
