


Reliability Data Set for 41,000 HDDs – Backblaze
Now Open Source
This is a Press Release edited by StorageNewsletter.com on February 12, 2015 at 2:40 pmThis article, Reliability Data Set For 41,000 HDDs Now Open Source – February 4, 2015, was published by Brian Beach, principal engineer, on the blog of Backblaze, Inc.
Stats Geeks: Now it’s Your Turn.
Backblaze Online Backup has released the raw data collected from the more than 41,000 disk drives in our data center. To the best of our knowledge this is the largest data set on disk drive performance ever to be made available publicly.
Over the past 16 months, I have been posting information about HDD reliability based on the raw data that we collect in the Backblaze data center. I have crunching those numbers to correlate drive failures with drive model numbers, with SMART statistics, and other variables.
There are lots of smart people out there who like working with data, and you may be one of them. Now it’s your turn to pore over the data and find hidden treasures of insight. All we ask is that if you find something interesting, that you post it publicly for the benefit of the computing community as a whole.
What’s In The Data?
The data that we have released is in two files, one containing the 2013 data and one containing the 2014 data. We’ll add data for 2015 and so on in a similar fashion.
Every day, the software that runs the Backblaze data center takes a snapshot of the state of every drive in the data center, including the drive’s serial number, model number, and all of its SMART data. The SMART data includes the number of hours the drive has been running, the temperature of the drive, whether sectors have gone bad, and many more things. (I did a blog post correlating SMART data with drive failures a few months ago.)
Each day, all of the drive ‘snapshots’ are processed and written to a new daily stats file. Each daily stats file has one row for every drive operational in the data center that day. For example, there are 365 daily stats files in the 2014 data package with each file containing a “snapshot” for each drive operational on any given day.
What Does It Look Like?
Each daily stats file is in CSV (column-separated value) format. The first line lists the names of the columns, and then each following line has all of the values for those columns.
Here are the columns:
- Date – The date of the file in yyyy-mm-dd format.
- Serial Number – The manufacturer-assigned serial number of the drive.
- Model – The manufacturer-assigned model number of the drive.
- Capacity – The drive capacity in bytes.
- Failure – Contains a “0” if the drive is OK. Contains a “1” if this is the last day the drive was operational before failing.
- SMART Stats – 80 columns of data, that are the Raw and Normalized values for 40 different SMART stats as reported by the given drive. Each value is the number reported by the drive.
The Wikipedia page on SMART has a good description of all of the data, and what the raw and scaled values are. The short version is that the raw value is the data directly from the drive. For example, the power On hours attribute reports the number of hours in the raw value. The normalized value is designed to tell you when the drive is OK. It starts at 100 and goes down to 0 as the drive gets sick. (Some drives count down from 200.)
How To Compute Failure Rates
One of my statistics professors once said: “it’s all about counting.” And that’s certainly true in this case.
A failure rate says what fraction of drives have failed over a given time span. Let’s start by calculating a daily failure rate, which will tell us what fraction of drives fail each day. We’ll start by counting ‘drive days’ and ‘failures’.
To count drive days, we’ll take a look every day and see how many drives are running. Here’s a week in the life of a (small) data center:
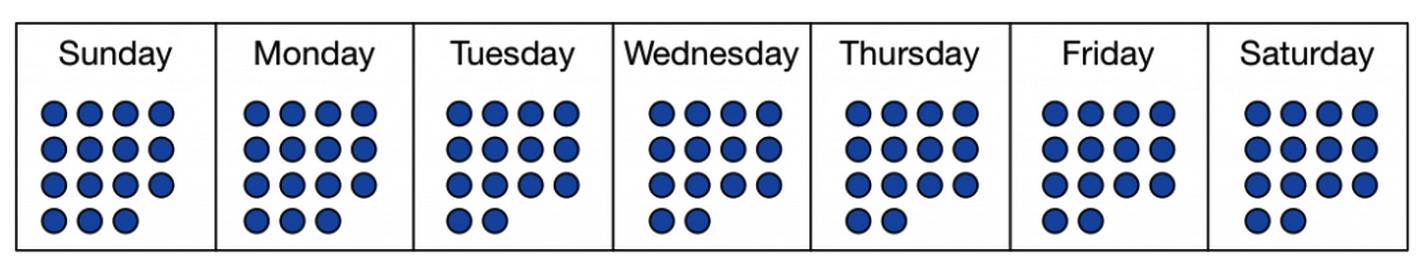
Each of the blue dots represents a drive running on a given day. On Sunday and Monday, there are 15 drives running. Then one goes away, and from Tuesday through Saturday there are 14 drives each day. Adding them up we get 15 + 15 + 14 + 14 + 14 + 14 + 14 = 100. That’s 100 drives days.
Now, let’s look at drive failures. One drive failed on Monday and was not replaced. Then one died on Wednesday and was promptly replaced. The red dots indicate the drive failures:
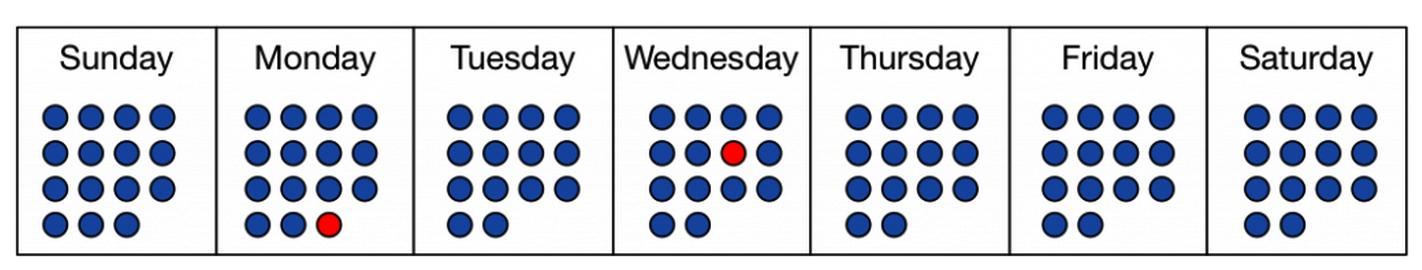
So we have 2 drive failures in 100 drive days of operation. To get the daily failure rate, you simply divide. 2 divided by 100 is 0.02, or 2%. The daily failure rate is 2%.
The annual failure rate is the daily failure rate multiplied by 365. If we had a full year made of weeks like the one above, the annual failure rate would be 730%.
Annual failures rates can be higher than 100%. Let’s think this through. Say we keep 100 drives running in our data center at all times, replacing drives immediately when they fail. At a daily failure rate of 2%, that means 2 drives fail each day, and after a year 730 drives will have died. We can have an annual failure rate above 100% if drives last less than a year on average.
Computing failure rates from the data that Backblaze has released is a matter of counting drive days and counting failures. Each row in each daily drive stats file is one drive day. Each failure is marked with a ‘1’ in the failure column. Once a drive has failed, it is removed from subsequent daily drive stats files.
To get the daily failure rate of drives in the Backblaze data center, you can take the number of failures counted in a given group of daily stats files, and divide by the number of rows in the same group of daily stats files. That’s it.
Where is the Data?
You’ll find links to download the data files. You’ll also find instructions on how to create your own sqlite database for the data, and other information related to the files you can download.


 Subscribe to our free daily newsletter
