


NetApp: Fiscal 2Q17 Financial Results
All-flash booming, may be back to growth next quarter
This is a Press Release edited by StorageNewsletter.com on November 21, 2016 at 2:41 pm| (in $ million) | 2Q16 | 2Q17 | 6 mo. 16 | 6 mo. 17 |
| Revenue | 1,445 | 1,340 | 2,780 | 2,634 |
| Growth | -7% | -5% | ||
| Net income (loss) | 114 | 109 | 84 | 173 |
• All flash array annualized net revenue run rate exceeded $1 billion
• Over 200PB of flash shipped
• Clustered Data ONTAP deployed on 86% of systems shipped
• $169 million returned to shareholders in share repurchases and cash dividends
NetApp, Inc., reported financial results for the second quarter fiscal year 2017, ended October 28, 2016.
Second Quarter Financial Results
Net revenues for the second quarter of fiscal year 2017 were $1.34 billion. GAAP net income for the second quarter of fiscal year 2017 was $109 million, or $0.38 per share, compared to GAAP net income of $114 million, or $0.39 per share, for the comparable period of the prior year. Non-GAAP net income for the second quarter of fiscal year 2017 was $169 million, or $0.60 per share, compared to non-GAAP net income of $181 million, or $0.61 per share, for the comparable period of the prior year.
Cash, Cash Equivalents and Investments
The company ended the second quarter of fiscal year 2017 with $4.4 billion in total cash, cash equivalents and investments. During the second quarter of fiscal year 2017, the company generated $158 million in cash from operations and returned $169 million to shareholders through share repurchases and a cash dividend.
The company announced the next cash dividend of $0.19 per share. The quarterly dividend will be paid on January 25, 2017, to shareholders of record as of the close of business on January 6, 2017.
“Our second quarter results are evidence of our ability to maintain a high level of execution while streamlining the business and pivoting to the growth areas of the market,” said George Kurian, CEO. “Our market-leading innovations in flash, next-generation data centers and hybrid cloud, coupled with a sharp focus on operational discipline, position NetApp to lead in the digital era.”
Q3 Fiscal Year 2017 Outlook
• Net revenues are expected to be in the range of $1.325 billion to $1.475 billion.
• GAAP earnings per share is expected to be in the range of $0.41 to $0.46 per share.
• Non-GAAP earnings per share is expected to be in the range of $0.72 to $0.77 per share.
Comments
For the 12th consecutive quarter in a row, revenue, at $1,340 million - at the midpoint of the guidance -, decreased year-over-year (see table below), this time down 7% Y/Y but up 4% Q/Q, the company being profitable since the beginning of its FY17.
But this decrease could be stopped in the next three-month period if the company realizes what it expects: revenue in the range of $1,325 million to $1,475 million or between -4% and +6% from one year ago. The midpoint implies a sequential increase of 4% and 1% Y/Y.
Revenue by business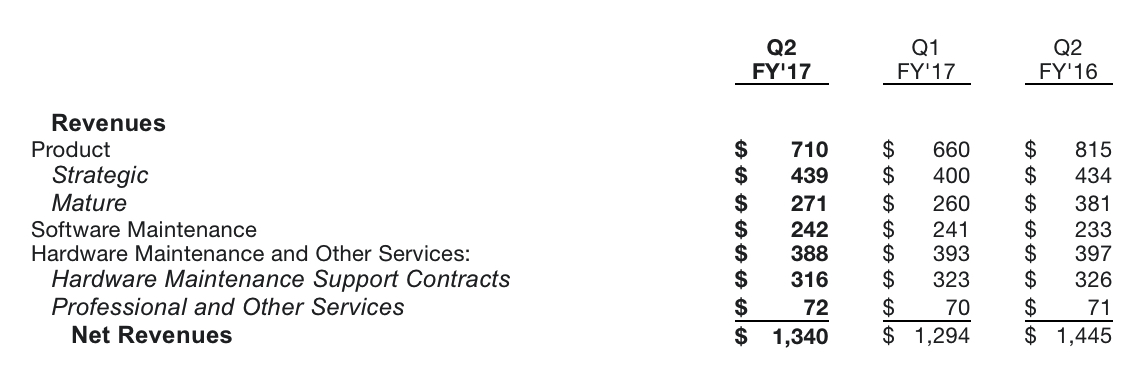
Product revenue of $710 million was up 7.5% sequentially and down 13% yearly.
NetApp's SSD subsystems are booming. In the second quarter, all flash array sales tripled Y/Y to an annualized net revenue run rate of $1 billion inclusive of all flash FAS, EF and SolidFire product and services.
The firm separates its activity into two businesses: mature and strategic solutions.
Net product revenue from mature ones declined at 29% year-over-year.
Strategic solutions comprised 62% of the total of net product revenue, and growth was flat against a tough compare in 2FQ16, but grew 10% sequentially.
Clustered ONTAP was deployed on 86% of FAS system shipped in the quarter, up from 70% a year ago. Unit shipments of Clustered ONTAP systems grew 14% Y/Y. The installed base of FAS systems continues to grow and Clustered ONTAP is now running on approximately 36% of company's systems into its "large and growing installed based," stated the company.
| Period | Revenue | Y/Y Growth | Net income (loss) |
| 1FQ14 | 1,516 | 5% | 82 |
| 2FQ14 | 1,550 | 1% | 167 |
| 3FQ14 | 1,610 | -1% | 192 |
| 4FQ14 | 1,649 | -4% | 197 |
| FY14 | 6,325 | -0% | 638 |
| 1FQ15 | 1,489 | -2% | 88 |
| 2FQ15 | 1,542 | -0% | 160 |
| 3FQ15 | 1,551 | -4% | 177 |
| 4FQ15 | 1,540 | -2% | 135 |
| FY15 | 6,123 | -3% | 560 |
| 1FQ16 | 1,335 | -10% | (30) |
| 2FQ16 | 1,445 | -9% | 114 |
| 3FQ16 | 1,386 | -11% | 153 |
| 4FQ16 | 1,380 | -10% | (8) |
| FY16 | 5,546 | -9% | 229 |
| 1FQ17 | 1,294 | -3% | 64 |
| 2FQ17 | 1,340 | -7% | 109 |


 Subscribe to our free daily newsletter
