


Imation: Fiscal 2Q15 Financial Results
Shrinking as usual
This is a Press Release edited by StorageNewsletter.com on August 13, 2015 at 2:19 pm| (in $ million) | 2Q14 | 2Q15 | 6 mo. 14 | 6 mo. 15 |
| Revenue | 178.6 | 150.6 | 357.5 | 306.0 |
| Growth | -16% | -14% | ||
| Net income (loss) | (21.4) | (17.4) | (38.9) | (31.8) |
Imation Corp. released financial results for the second quarter ended June 30, 2015 that were in line with the company’s expectations.
Q2 Overview
For the second quarter of 2015, Imation reported net revenue of $150.6 million, gross margin of 19.3%, an operating loss from continuing operations of $15.9 million, including special charges of $1.5 million, diluted loss per share from continuing operations of $0.42 and a cash balance of $89.8 million.
Foreign currency exchange rates negatively impacted total Q2 2015 revenues by 8.1%, or $14.5 million, compared to Q2 2014. Gross margin in the TSS business segment increased by 2.1% to 21.0% from Q2 2014. The increase is due to a favorable product mix in both the Storage Solution and Mobile Security offerings.
Imation’s CEO Mark Lucas commented: “Our efforts to transform Imation into a global leader in storage and security continue to progress. We remain intensely focused on taking the necessary steps to position the enterprise for sustainable growth and have retained a restructuring advisor to optimize our cost structure and assist with performance improvement.
“We continue to invest in our Tiered Storage and Security Solutions segment, which serves as the foundation for the company’s profitable growth over the long-term. We are maintaining a focus on higher growth markets where we can bring our enterprise quality solutions to our small-to medium-sized business customers within key vertical markets. Of note, sales for our Nexsan business grew double digits, excluding currency impact, for the second consecutive quarter. We also continue to see good momentum in customer trials of our IronKey products.”
“We remain committed to investing in innovation. During the quarter, we introduced a set of new features for our Nexsan E-Series family in order to offer world-class storage solutions that meet the large capacity demands resulting from the exponential growth in data. We continue to enhance our recently launched Secure Data Movement Architecture (SDMA), our holistic approach to actively managing high-value data files and safeguarding those files from tampering, loss or corruption through their entire lifecycle. During the quarter, we also introduced Imation Secure Data Discovery – an interactive software tool that helps organizations identify their high-value data and determine the most efficient way to store and protect that data.”
Lucas concluded: “We continue to aggressively manage our costs, which is reflected in our reduced cash utilization in the quarter compared to Q1 2015, and to maximize cash flow in our legacy businesses, where we have maintained market share despite the continued secular declines. We are working closely with our Board and our advisers to drive our transformation, and we continue to explore all potential strategic alternatives designed to maximize shareholder value.”
Detailed Q2 2015 Analysis
The following financial results are for continuing operations for the current and prior periods unless otherwise indicated.
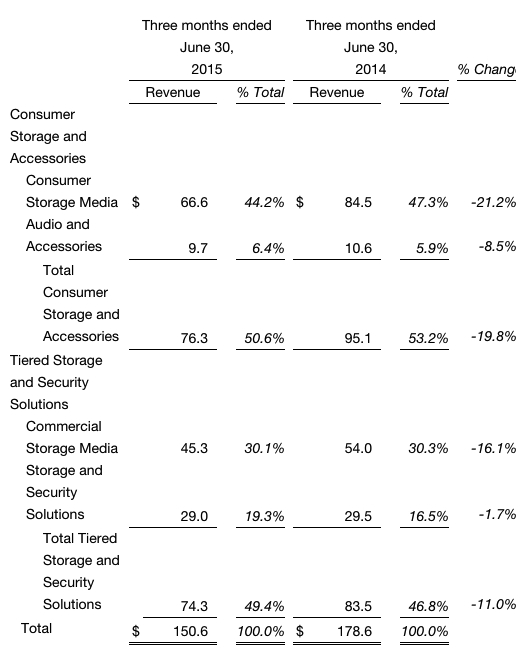
Net revenue for Q2 2015 was $150.6 million, down 15.7% from Q2 2014. From a segment perspective, TSS declined 11.0% and CSA declined 19.8%. Within the TSS segment, Storage and Security Solutions declined year-over-year by 1.7%, and Commercial Storage Media declined 16.1%.
The decline in Storage and Security Solutions was primarily due to negative foreign currency impacts.
Commercial Storage Media declined due to lower revenue from magnetic tape products. CSA revenue decreased due to the ongoing decline in sales of optical media products, which was in line with industry trends, along with negative foreign currency impacts.
Foreign currency exchange rates negatively impacted total Q2 2015 revenues by 8.1% compared to Q2 2014.
Gross margin for Q2 2015 was 19.3%, 0.3 percentage points better than Q2 2014. CSA gross margin was 17.6%, down from 19.0% in Q2 2014, primarily driven by product mix. TSS gross margin for Q2 2015 was 21.0%, up from 18.9% in Q2 2014, driven by higher margins in the Storage and Security Solutions business which reflects the company’s focus on increasing gross margins as part of its strategic transformation.
Selling, general and administrative expenses in Q2 2015 were $38.6 million, down $5.7 million compared with Q2 2014 expenses of $44.3 million, due to lower spending and currency impacts. Since January 2013, Imation has reduced legacy operating costs by over $109 million.
R&D expenses in Q2 2015 were $4.8 million versus $4.5 million in Q2 2014. The company continued to invest in new product development in its priority businesses and has aggressively reduced R&D expenses associated with legacy media products.
Special charges were $1.5 million in Q2 2015 compared to special charges of $5.2 million in Q2 2014. Special charges in Q2 2015 were primarily related to costs associated with our strategic review and contested proxy process.
Operating loss from continuing operations was $15.9 million in Q2 2015 compared with an operating loss of $20.1 million in Q2 2014. Excluding the impact of special charges described above, adjusted operating loss would have been $14.4 million in Q2 2015 compared with adjusted operating loss on the same basis of $14.9 million in Q2 2014.
Income tax expense was $0.2 million in Q2 2015 compared with an income tax benefit of $1.6 million in Q2 2014. The benefit in Q2 2014 was primarily due to the mix of taxable income by country. The company maintains a valuation allowance related to its U.S. deferred tax assets and, therefore, no tax expense or benefit was recorded related to its U.S. results in either period.
Loss per diluted share from continuing operations was $0.42 in Q2 2015 compared with a loss per diluted share of $0.48 in Q2 2014. Excluding the impact of special items, adjusted loss per diluted share would have been $0.39 in Q2 2015 compared with a loss per diluted share of $0.35 in Q2 2014.
Cash and cash equivalents balance was $89.8 million as of June 30, 2015, down $6.4 million during the quarter, in line with expectations. During the quarter, Imation received $1.2 million from the sale of its Weatherford, Oklahoma facility. The anticipated decline in cash balance reflects the ongoing investment in Storage and Security Solutions growth initiatives and seasonal working capital changes and payments, as well as currency impacts.
Year-To-Date Summary
For the six months ended June 30, 2015, Imation reported net revenue of $306.0 million, down 14.4% compared with the same period last year.
Operating loss from continuing operations totaled $28.9 million for the six months ended June 30, 2015, including special charges of $2.7 million, and a diluted loss per share from continuing operations of $0.77.
For the six months ended June 30, 2014, Imation reported net revenue of $357.5 million, an operating loss from continuing operations of $36.2 million, including special charges of $7.3 million, and a diluted loss per share from continuing operations of $0.89.
Comments
It's not a nice job to repeat our comments for each three-month period.
The same trend is continuing for shrinking Imation since several quarters. The company is betting on storage systems (Nexsan) and security products to get back to growth but their revenue together declined 11% sequentially and cannot compensate continuing poor results of other traditional activities (consumer and commercial media, and accessories) down 20%.
Revenue by products (in $ million)
No guidance was revealed for next quarter, a sign that Imation even does not really know its short-term future.
What is going to do the next CEO of the company as current one, Mark Lucas, unable to redress Imation since his arrival in May 2010, will leave after September 21, 2015?
The idea seems to be to separate the company into two businesses: storage systems and security on one side, and on the other side to sell the activity of accessories, consumer and commercial media.


 Subscribe to our free daily newsletter
