


Brocade: Fiscal 1Q14 Financial Results
SAN revenue at $412 million, down 1% Y/Y and up 8% sequentially
This is a Press Release edited by StorageNewsletter.com on February 17, 2014 at 3:02 pm| (in $ million) | 1Q13 | 1Q14 |
| Revenue | 588.7 | 564.5 |
| Growth | -4% | |
| Net income (loss) |
(21.3) | 80.9 |
Brocade Communication Systems, Inc. reported financial results for its first fiscal quarter ended January 25, 2014.
It reported first quarter revenue of $565 million, down 4% year-over-year and up 1% quarter-over-quarter.
The company reported GAAP diluted earnings per share (EPS) of $0.18, up from a loss of $0.05 per share in Q1 2013. Non-GAAP diluted EPS was $0.24, up from $0.21 in Q1 2013.
“Brocade achieved solid results in Q1, exceeding our outlook for revenue and profitability,” said Lloyd Carney, CEO of Brocade. “Our performance was driven by the strength of our SANing (SAN) business as customers continue to adopt Gen 5 FC networks for their highly virtualized data centers and high-performance storage environments, including SSDs. While the overall IP networking business declined year-over-year, we achieved our outlook for the quarter. This is a transformational year for Brocade and we remain committed to our mission to be the network provider of choice to the world’s data centers.”
Summary of Q1 2014 results:
SAN business revenue, including products and services, was $412 million, down 1% year-over-year and up 8% sequentially. SAN business revenue grew sequentially across all product segments and performed better than the company’s outlook for Q1 2014. Gen 5 FC products represented approximately 71% of director and switch revenue in the quarter, higher than the 42% reported in Q1 2013 and 69% in Q4 2013.
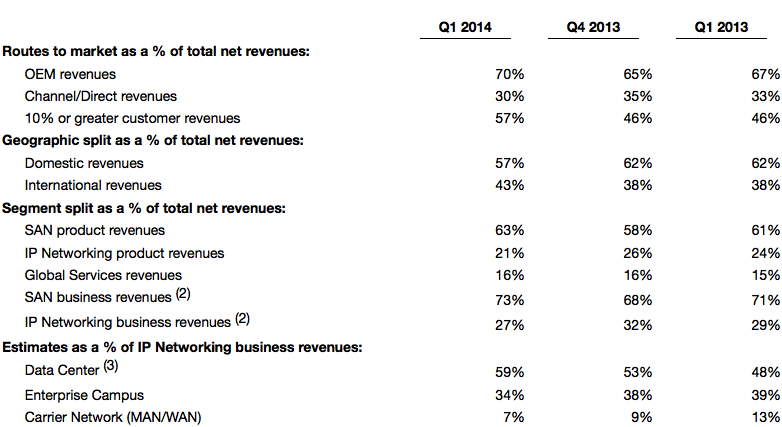
2) SAN and IP networking business revenues include product, support and services revenues.
3) Data Center includes enterprise, service provider and government data center revenues.
IP networking business revenue, including products and services, was $153 million, down 11% year-over-year and 15% quarter-over-quarter. The year-over-year and sequential decline was principally due to lower sales into the U.S. Federal government as well as lower non-Federal sales in the Americas region. During Q1 2014, an estimated 59% of our IP networking product revenue came from data center customers, a favorable shift in the mix of our IP business from an estimated 48% in Q1 2013 and 53% in Q4 2013.
GAAP gross margin was 66.0%, compared with 63.5% in Q1 2013 and 64.9% in Q4 2013. Non-GAAP gross margin was 67.7%, compared with 66.0% in Q1 2013 and 67.2% in Q4 2013. The year-over-year improvement in gross margin was due to a favorable revenue mix shift to more SAN products, a favorable product and customer mix within the IP Networking business, and lower manufacturing and overhead costs. The sequential improvement in gross margin was due to a more favorable overall product mix shift to SAN product revenue.
GAAP operating margin was 21.5%, compared with 15.8% in Q1 2013 and 15.0% in Q4 2013. Non-GAAP operating margin was 27.9%, compared with 23.5% in Q1 2013 and 26.6% in Q4 2013. The year-over-year and sequential improvement in operating margin was due to higher gross margin and lower operating expenses. Non-GAAP operating expenses of $225 million were down 10% year-over-year and 1% quarter-over-quarter.
Operating cash flow was $109 million, up 85% year-over-year and down 36% quarter-over-quarter. The year-over-year increase in operating cash flow was primarily due to increased operating profits and the timing of payments for employee incentives. The quarter-over-quarter decrease in operating cash flow was due to the payment in Q1 2014 of employee incentive compensation earned during fiscal 2013, as well as an increase in the amount of the excess tax benefit from stock-based compensation.
GAAP diluted EPS was $0.18, up from a loss of $0.05 in Q1 2013 and up 29% from Q4 2013. The year-over-year increase in GAAP diluted EPS was primarily due to a $0.17 per share charge in Q1 2013 from the change in California tax law and the related reduction in the company’s deferred tax assets as well as higher operating income. The quarter-over-quarter increase in GAAP EPS was primarily due to higher net income resulting from lower restructuring costs.
Non-GAAP diluted EPS of $0.24 was up 13% from Q1 2013 and unchanged from Q4 2013. The year-over-year increase was primarily due to decreased spending and reduced diluted shares outstanding.
Non-GAAP average diluted shares outstanding for Q1 2014 were 454 million shares, down 3% year-over-year and down 1% quarter-over-quarter. The company repurchased 16.7 million shares for $140 million at an average price of $8.42 during Q1 2014. Subsequent to the end of Q1 2014, the company has repurchased an additional 3.3 million shares for $31 million and has approximately $829 million remaining in the board-authorized share repurchase program as of February 13, 2014.
Comments
Abstracts the earnings call transcript:
Lloyd Carney, CEO:
"Brocade’s net fabric sales were up 61% year-over-year as both enterprise and search provider customers implement next generation networks to support their increasingly virtualized data centers."
Dan Fairfax, CFO:
"For our total SAN business including hardware products and SAN-based important services, Q1 '14 revenue was $412 million, down 1% on Q1 '13 and up 8% sequentially.
"Our business result and we saw strength in our SAN product revenue in the quarter from recent storage off to very product launches from our OEM partners. Our Gen 5 products represented 71% of director and switch revenue during the quarter compared with 59% in Q4 '13 and 42% in Q1 '13.
"For Q2 '14 we expect SAN revenue to be down 10% to 13% quarter-over-quarter."


 Subscribe to our free daily newsletter
