


Backblaze Updates Lifetime HDD Failure Rates in 1Q17
Among 17 drives, best result for HGST 4TB HMS5C4040ALE640, worst for WDC 6TB WD30EFRX
This is a Press Release edited by StorageNewsletter.com on May 11, 2017 at 2:52 pm This study was published on the blog of Backblaze, Inc. on May 9, 2017, and written by Andy Klein.
Hard Drive Stats for Q1 2017
In this update, we’ll review the Q1 2017 and lifetime HDD failure rates for all our current drive models, and we’ll look at a relatively new class of drives for us – ‘enterprise’. We’ll share our observations and insights, and as always, you can download the HDD statistics data we use to create these reports.
Our HDD Data Set
Backblaze has now recorded and saved daily HDD statistics from the drives in our data centers for over 4 years. This data includes the SMART attributes reported by each drive, along with related information such a the drive serial number and failure status.
As of March 31, 2017 we had 84,469 operational HDDs. Of that there were 1,800 boot drives and 82,669 data drives. For our review, we remove drive models of which we have less than 45 drives, leaving us to analyze 82,516 HDDs for this report. There are currently 17 different HDDs models, ranging in size from 3 to 8 TB in size. All of these models are 3.5-inch drives.
HDD Reliability Statistics for Q1 2017
Since our last report in Q4 2016, we have added 10,577 additional HDDs to bring us to the 82,516 drives we’ll focus on. We’ll start by looking at the statistics for the period of January 1, 2017 through March 31, 2017 – Q1 2017. This is for the drives that were operational during that period, ranging in size from 3 to 8TB as listed below.
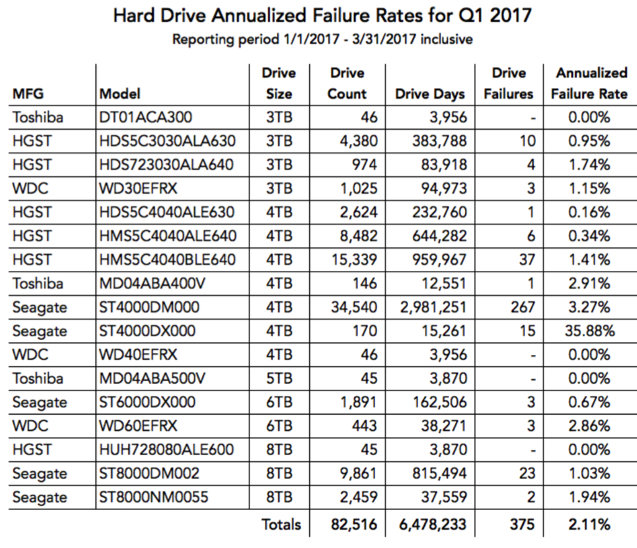
Observations and Notes on the Q1 Review
You’ll notice that some of the drive models have a failure rate of zero. Here a failure rate of zero means there were no drive failures for that model during Q1 2017. Later, we will cover how these same drive models failed over their lifetime. Why is the quarterly data important? We use it to look for anything unusual. For example, in Q1 the 4TB Seagate drive model ST4000DX000 has a high failure rate of 35.88%, while the lifetime annualized failure rate for this model is much lower, 7.50%. In this case, we only have a 170 drives of this particular drive model, so the failure rate is not statistically significant, but such information could be useful if we were using several thousand drives of this particular model.
There were a total 375 drive failures in Q1.
A drive is considered failed if one or more of the following conditions are met:
• The drive will not spin up or connect to the OS.
• The drive will not sync, or stay synced, in a RAID Array (see note below).
• The Smart Stats we use show values above our thresholds.
Note: Our stand-alone Storage Pods use RAID-6, our Backblaze Vaults use our own open-sourced implementation of Reed-Solomon erasure coding. Both techniques have a concept of a drive not syncing or staying synced with the other member drives in its group.
The annualized HDD failure rate for Q1 in our current population of drives is 2.11%. That’s a bit higher than previous quarters, but might be a function of us adding 10,577 new drives to our count in Q1. We’ve found that there is a slightly higher rate of drive failures early on, before the drives ‘get comfortable’ in their new surroundings. This is seen in the drive failure rate ‘bathtub curve’ we covered in a previous post.
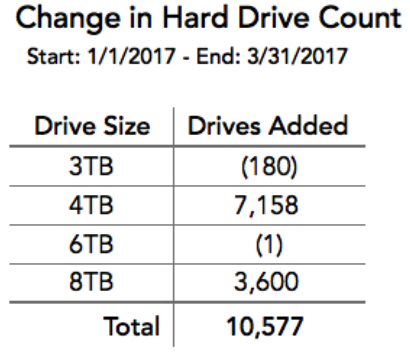
10,577 More Drives
The additional 10,577 drives are really a combination of 11,002 added drives, less 425 drives that were removed. The removed drives were in addition to the 375 drives marked as failed, as those were replaced 1 for 1. The 425 drives were primarily removed from service due to migrations to higher density drives.
The table below shows the breakdown of the drives added in Q1 2017 by drive size.
Lifetime HDD Failure Rates for Current Drives
The table below shows the failure rates for the HDD models we had in service as of March 31, 2017. This is over the period beginning in April 2013 and ending March 31, 2017. If you are interested in the HDD failure rates for all the HDDs we’ve used over the years, please refer to our 2016 HDD review.
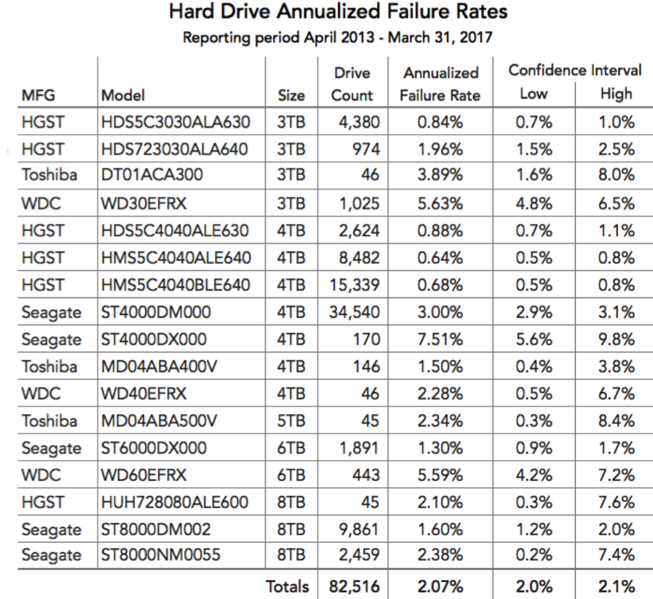
The annualized failure rate for the drive models listed above is 2.07%. This compares to 2.05% for the same collection of drive models as of the end of Q4 2016. The increase makes sense given the increase in Q1 2017 failure rate over previous quarters noted earlier. No new models were added during the current quarter and no old models exited the collection.
Backblaze is Using Enterprise Drives – Oh My!
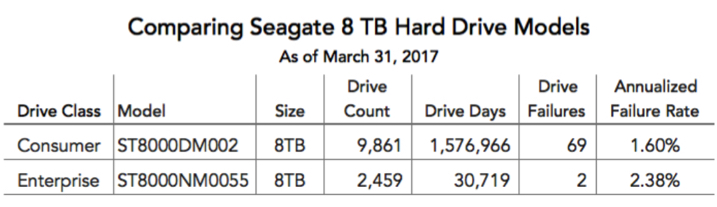
Some of you may have noticed we now have a significant number of enterprise drives in our data center, namely 2,459 Seagate 8TB drives, model: ST8000NM055. The HGST 8TB drives were the first true enterprise drives we used as data drives in our data centers, but we only have 45 of them. So, why did we suddenly decide to purchase 2,400+ of the Seagate 8TB enterprise drives? There was a very short period of time, as Seagate was introducing new and phasing out old drive models, that the cost per terabyte of the 8TB enterprise drives fell within our budget. Previously we had purchased 60 of these drives to test in one Storage Pod and were satisfied they could work in our environment. When the opportunity arose to acquire the enterprise drives at a price we liked, we couldn’t resist.
Here’s a comparison of the 8TB consumer drives versus the 8TB enterprise drives to date:
What have we learned so far…
1 It is too early to compare failure rates – The oldest enterprise drives have only been in service for about 2 months, with most being placed into service just prior to the end of Q1. The Backblaze Vaults the enterprise drives reside in have yet to fill up with data. We’ll need at least 6 months before we could start comparing failure rates as the data is still too volatile. For example, if the current enterprise drives were to experience just 2 failures in Q2, their annualized failure rate would be about 0.57% lifetime.
2 The enterprise drives load data faster – The Backblaze Vaults containing the enterprise drives, loaded data faster than the Backblaze Vaults containing consumer drives. The vaults with the enterprise drives loaded on average 140TB per day, while the vaults with the consumer drives loaded on average 100TB per day.
3 The enterprise drives use more power – No surprise here as according to the Seagate specifications the enterprise drives use 9W average in idle and 10W average in operation. While the consumer drives use 7.2W average in idle and 9W average in operation. For a single drive this may seem insignificant, but when you put 60 drives in a 4U Storage Pod chassis and then 10 chassis in a rack, the difference adds up quickly.
4 Enterprise drives have some nice features – The Seagate enterprise 8TB drives we used have PowerChoice technology that gives us the option to use less power. The data loading times noted above were recorded after we changed to a lower power mode. In short, the enterprise drive in a low power mode still stored 40% more data per day on average than the consumer drives.
5 While it is great that the enterprise drives can load data faster, drive speed has never been a bottleneck in our system. A system that can load data faster will just ‘get in line’ more often and fill up faster. There is always extra capacity when it comes to accepting data from customers.
Wrapping Up
We’ll continue to monitor the 8TB enterprise drives and keep reporting our findings.


 Subscribe to our free daily newsletter
