


WW Cloud IT Infrastructure Spend Grew 9% to $33 Billion in 2016 – IDC
Top vendors: Dell, HE/New HC3 Group, Cisco, Huawei, Lenovo, IBM and NetApp
This is a Press Release edited by StorageNewsletter.com on April 10, 2017 at 2:33 pmAccording to the International Data Corporation‘s Worldwide Quarterly Cloud IT Infrastructure Tracker, vendor revenue from sales of infrastructure products (server, storage, and Ethernet switch) for cloud IT, including public and private cloud, grew by 9.2% year over year to $32.6 billion in 2016, with vendor revenue for 4Q16 growing at 7.3% to $9.2 billion.
Cloud IT infrastructure sales as a share of overall worldwide IT spending climbed to 37.2% in 4Q16, up from 33.4% a year ago. Revenue from infrastructure sales to private cloud grew by 10.2% to $3.8 billion, and to public cloud by 5.3% to $5.4 billion. In comparison, revenue in the traditional (non-cloud) IT infrastructure segment decreased 9.0% Y/Y in the fourth quarter. Private cloud infrastructure growth was led by Ethernet switch at 52.7% Y/Y growth, followed by server at 9.3%, and storage at 3.6%. Public cloud growth was also led by Ethernet switch at 30.0% Y/Y growth, followed by server at 2.4% and a 2.1% decline in storage. In traditional IT deployments, storage declined the most (10.8% Y/Y), with Ethernet switch and server declining 3.4% and 9.0%, respectively.
“Growth slowed to single digits in 2016 in the cloud IT infrastructure market as hyperscale cloud datacenter growth continued its pause,” said Kuba Stolarski, research director for computing platforms, IDC. “Network upgrades continue to be the focus of public cloud deployments, as network bandwidth has become by far the largest bottleneck in cloud datacenters. After some delays for a few hyperscalers, datacenter buildouts and refresh are expected to accelerate throughout 2017, built on newer generation hardware, primarily using Intel’s Skylake architecture.”
From a regional perspective, vendor revenue from cloud IT infrastructure sales grew fastest in Japan at 42.3% Y/Y in 4Q16, followed by Middle East & Africa at 33.6%, Canada at 16.6%, Western Europe at 15.6%, AsiaPac (excluding Japan) at 14.5%, Central and Eastern Europe at 11.6%, Latin America at 9.9%, and the United States at 0.1%.
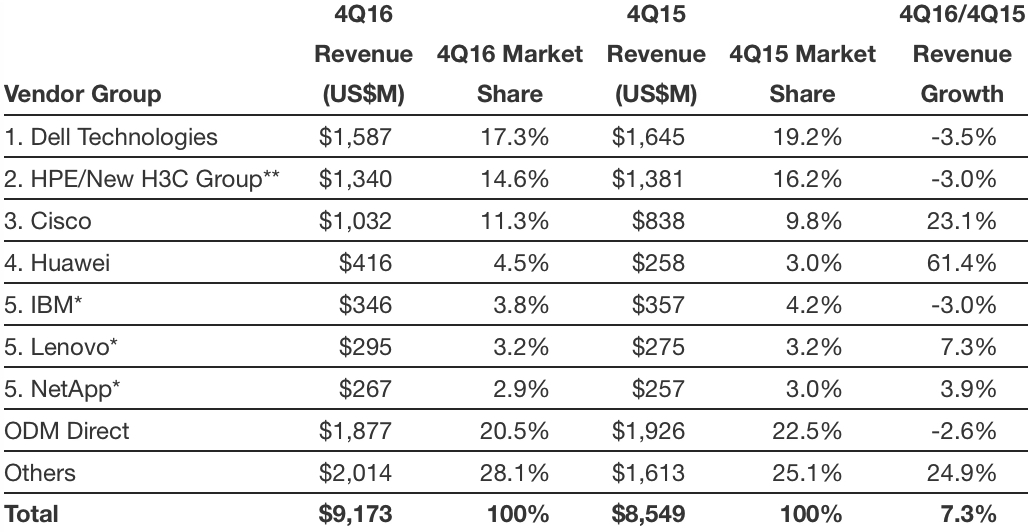
Top 5 Vendors, WW Cloud IT Infrastructure Vendor Revenue, 4Q16
(revenues in million, excludes double counting of storage and servers)
Top 5 Vendor Group, WW Cloud IT Infrastructure Vendor Revenue, 2016
(revenue in million, excludes double counting of storage and servers)

Notes:
* IDC declares a statistical tie in the worldwide cloud IT infrastructure market when there is a difference of one% or less in the vendor revenue shares among two or more vendors.
** Due to the existing joint venture between HPE and the New H3C Group, IDC will be reporting external market share on a global level for HPE as ‘HPE/New H3C Group’ starting from Q2 2016 and going forward.
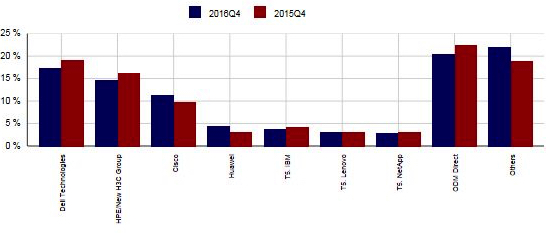
WW Cloud IT Infrastructure Top 5 Cloud Vendors
4Q16 vs. 4Q15 (shares based on vendor revenue)
Taxonomy Notes:
IDC defines cloud services more formally through a checklist of key attributes that an offering must manifest to end users of the service. Public cloud services are shared among unrelated enterprises and consumers; open to a largely unrestricted universe of potential users; and designed for a market, not a single enterprise. The public cloud market includes variety of services designed to extend or, in some cases, replace IT infrastructure deployed in corporate datacenters. It also includes content services delivered by a group of suppliers IDC calls Value Added Content Providers (VACP). Private cloud services are shared within a single enterprise or an extended enterprise with restrictions on access and level of resource dedication and defined/controlled by the enterprise (and beyond the control available in public cloud offerings); can be onsite or offsite; and can be managed by a third-party or in-house staff. In private cloud that is managed by in-house staff, ‘vendors (cloud service providers)’ are equivalent to the IT departments/shared service departments within enterprises/groups. In this utilization model, where standardized services are jointly used within the enterprise/group, business departments, offices, and employees are the ‘service users.’


 Subscribe to our free daily newsletter
